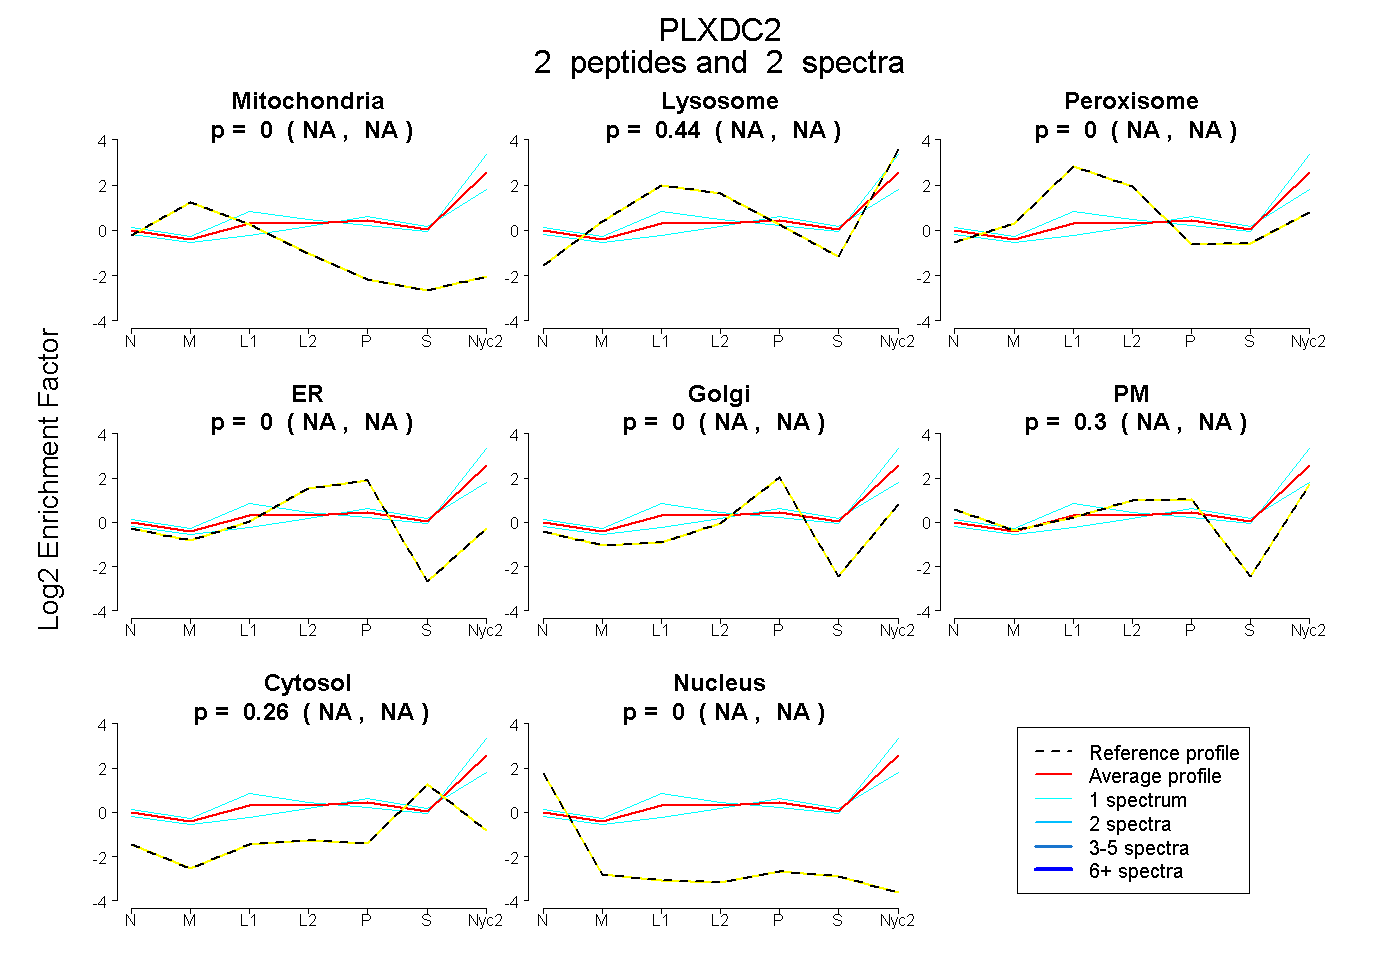
 2
2peptides
spectra
NA | NA
NA | NA
NA | NA
NA | NA
NA | NA
NA | NA
NA | NA
NA | NA
| Plot | Mito | Lyso | Perox | ER | Golgi | PM | Cytosol | Nucleus | |||||
| Expt A |
2 peptides |
2 spectra |
|
0.000 NA | NA |
0.437 NA | NA |
0.000 NA | NA |
0.000 NA | NA |
0.000 NA | NA |
0.302 NA | NA |
0.261 NA | NA |
0.000 NA | NA |
| 1 spectrum, IIFGYK | 0.000 | 0.287 | 0.000 | 0.000 | 0.027 | 0.341 | 0.345 | 0.000 | ||
| 1 spectrum, IALHLK | 0.000 | 0.594 | 0.000 | 0.000 | 0.000 | 0.234 | 0.172 | 0.000 |
| Plot | Lyso | Other | |||||||||||
| Expt C |
1 peptide |
1 spectrum |
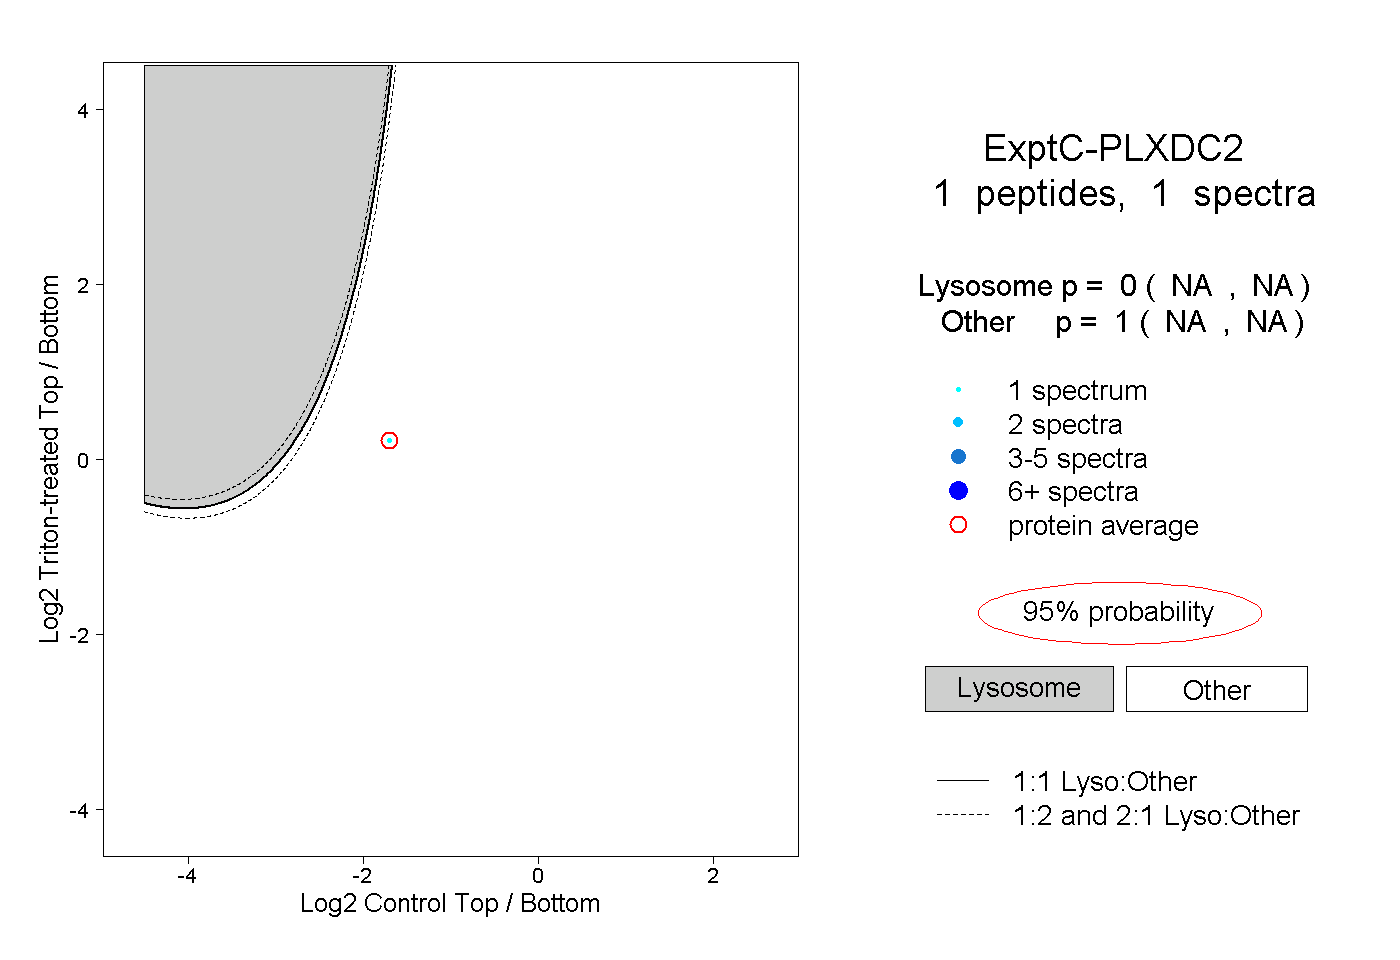 |
0.000 NA | NA |
1.000 NA | NA |