 2
2peptides
spectra
0.000 | 0.000
0.879 | 0.945
0.000 | 0.000
0.000 | 0.000
0.000 | 0.082
0.000 | 0.000
0.008 | 0.082
0.000 | 0.000
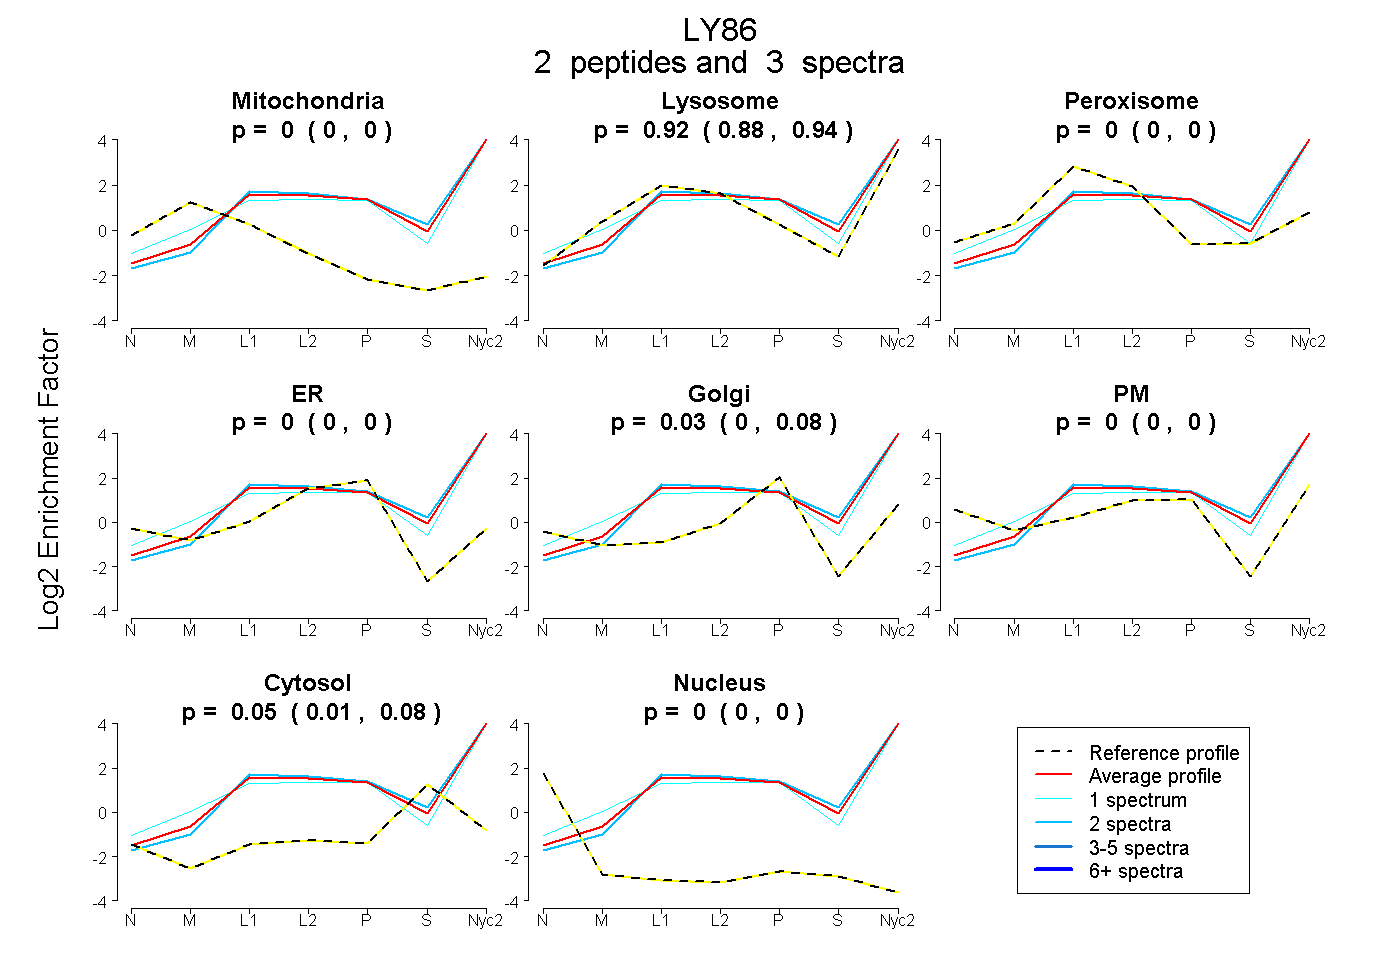
| Plot | Mito | Lyso | Perox | ER | Golgi | PM | Cytosol | Nucleus | |||||
| Expt A |
2 peptides |
3 spectra |
|
0.000 0.000 | 0.000 |
0.917 0.879 | 0.945 |
0.000 0.000 | 0.000 |
0.000 0.000 | 0.000 |
0.034 0.000 | 0.082 |
0.000 0.000 | 0.000 |
0.049 0.008 | 0.082 |
0.000 0.000 | 0.000 |
| 2 spectra, QIQPNLNIR | 0.000 | 0.921 | 0.000 | 0.000 | 0.000 | 0.000 | 0.079 | 0.000 | ||
| 1 spectrum, FSFCGR | 0.000 | 0.872 | 0.000 | 0.000 | 0.128 | 0.000 | 0.000 | 0.000 |
| Plot | Lyso | Other | |||||||||||
| Expt C |
2 peptides |
3 spectra |
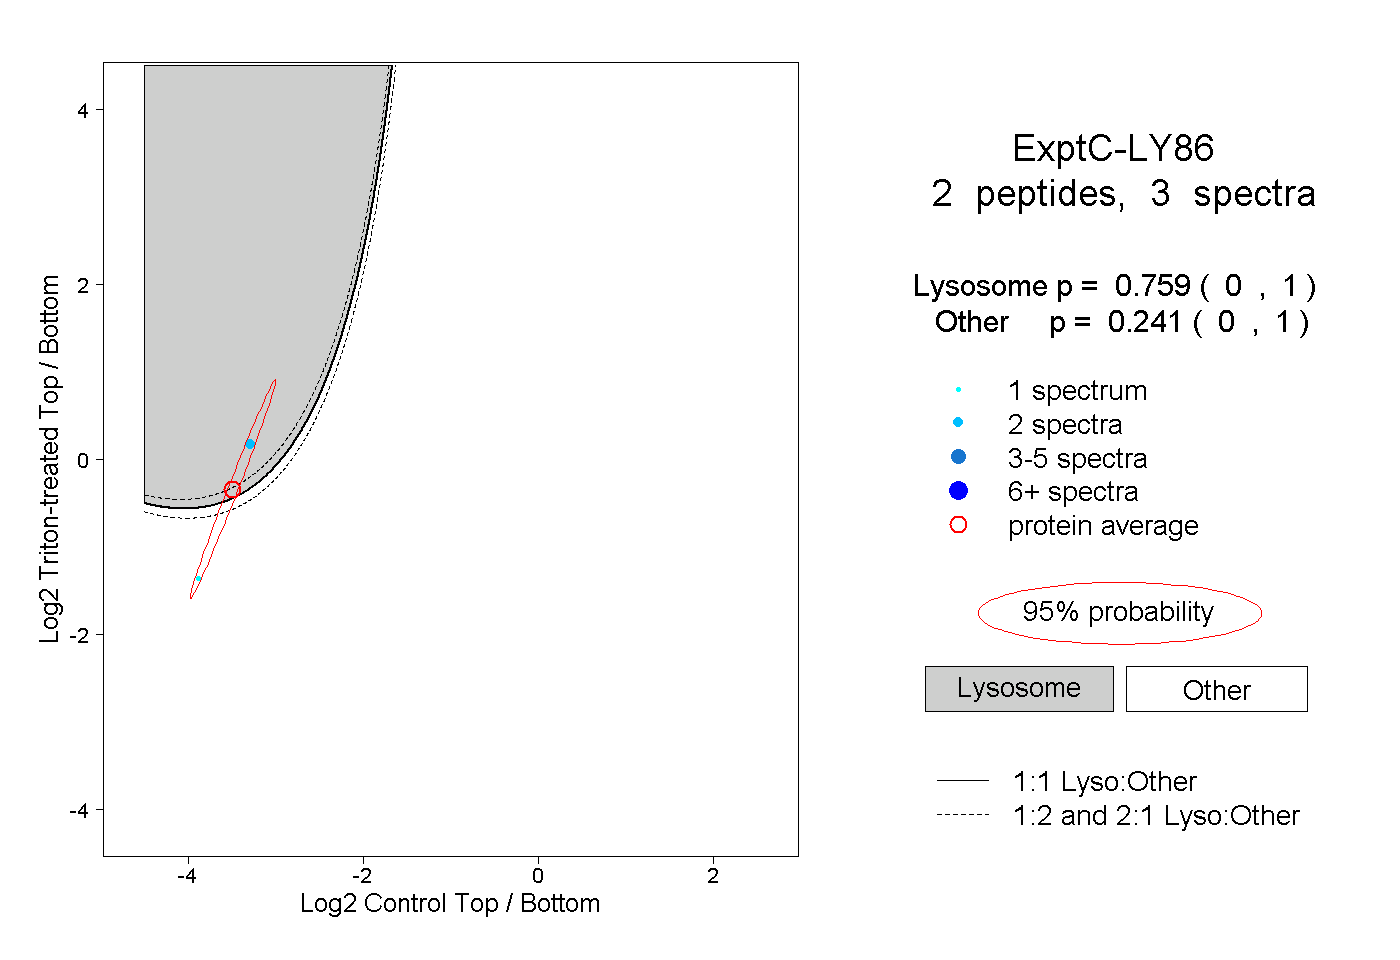 |
0.759 0.000 | 1.000 |
0.241 0.000 | 1.000 |