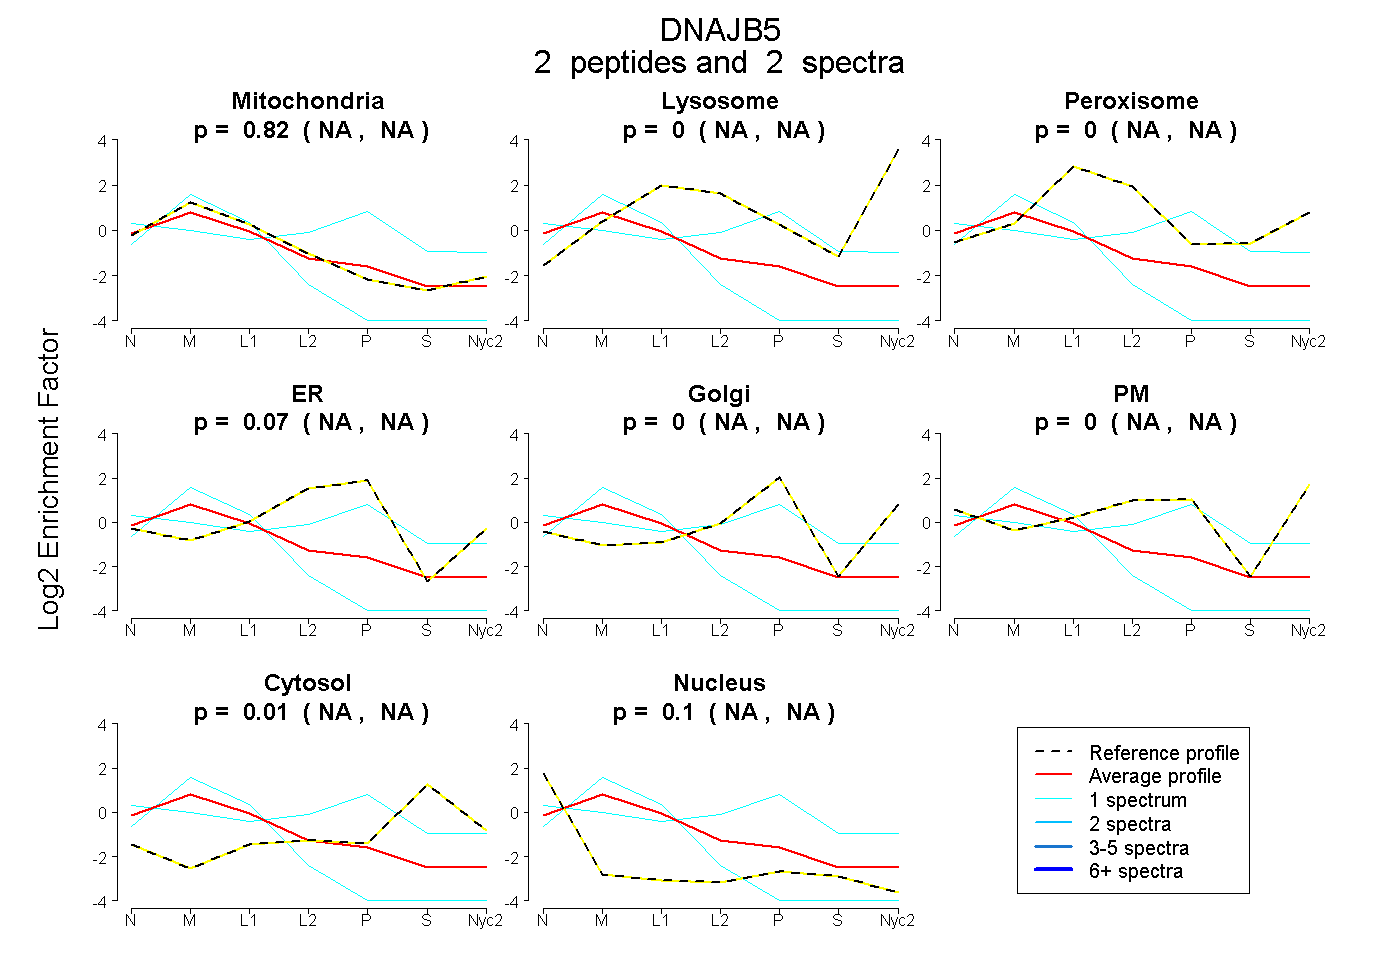
 2
2peptides
spectra
NA | NA
NA | NA
NA | NA
NA | NA
NA | NA
NA | NA
NA | NA
NA | NA
| Plot | Mito | Lyso | Perox | ER | Golgi | PM | Cytosol | Nucleus | |||||
| Expt A |
2 peptides |
2 spectra |
|
0.824 NA | NA |
0.000 NA | NA |
0.000 NA | NA |
0.067 NA | NA |
0.000 NA | NA |
0.000 NA | NA |
0.012 NA | NA |
0.097 NA | NA |
| 1 spectrum, LTPQTR | 0.245 | 0.000 | 0.006 | 0.363 | 0.154 | 0.024 | 0.209 | 0.000 | ||
| 1 spectrum, VQDPPVVHELR | 0.879 | 0.000 | 0.000 | 0.000 | 0.000 | 0.000 | 0.000 | 0.121 |
| Plot | Lyso | Other | |||||||||||
| Expt C |
1 peptide |
1 spectrum |
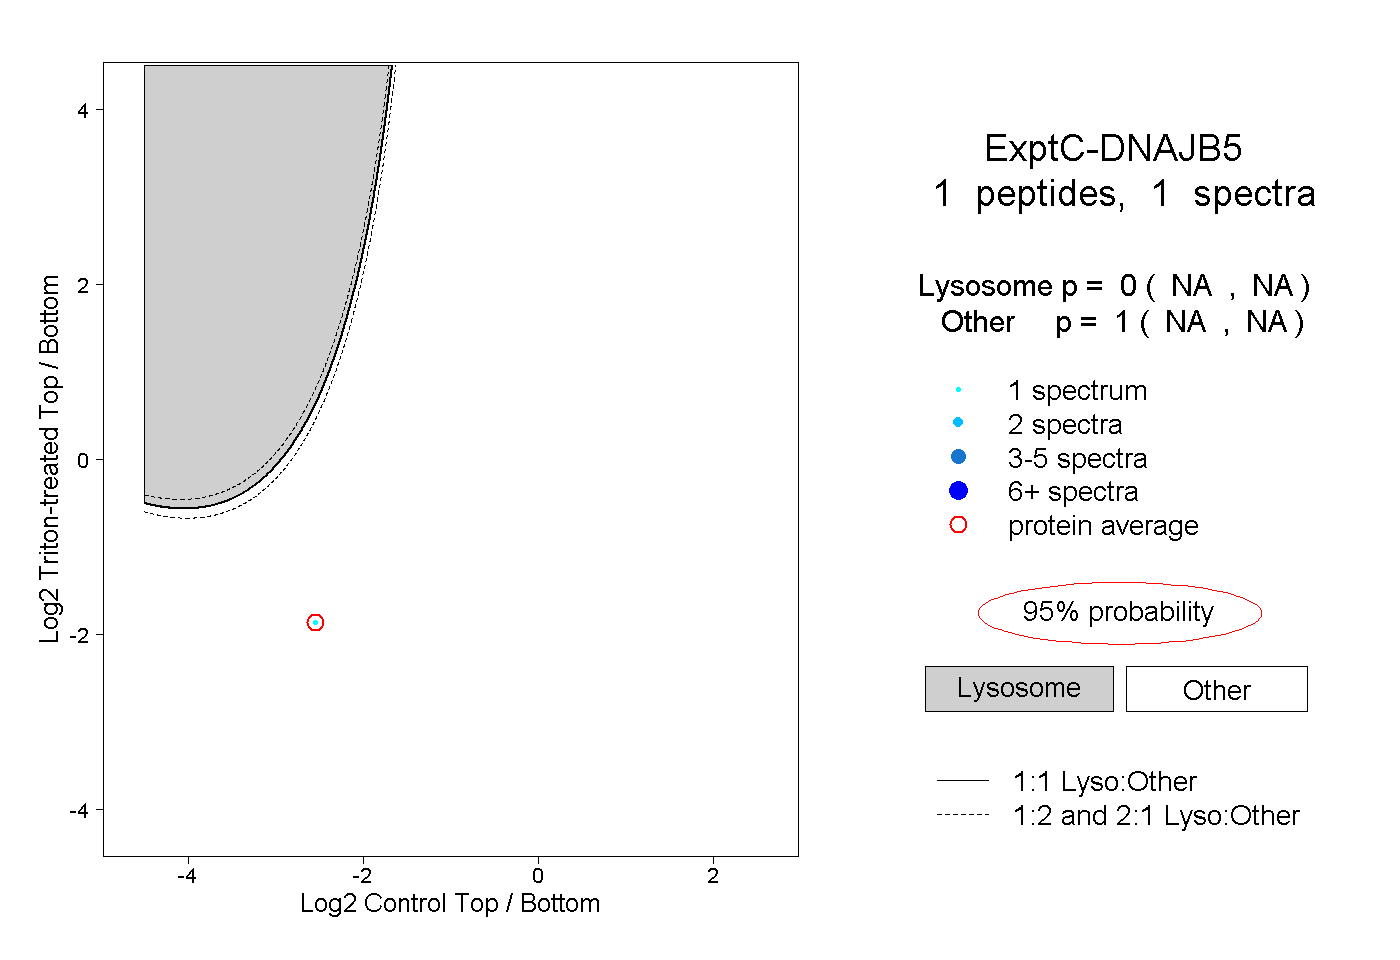 |
0.000 NA | NA |
1.000 NA | NA |