13
13peptides
spectra
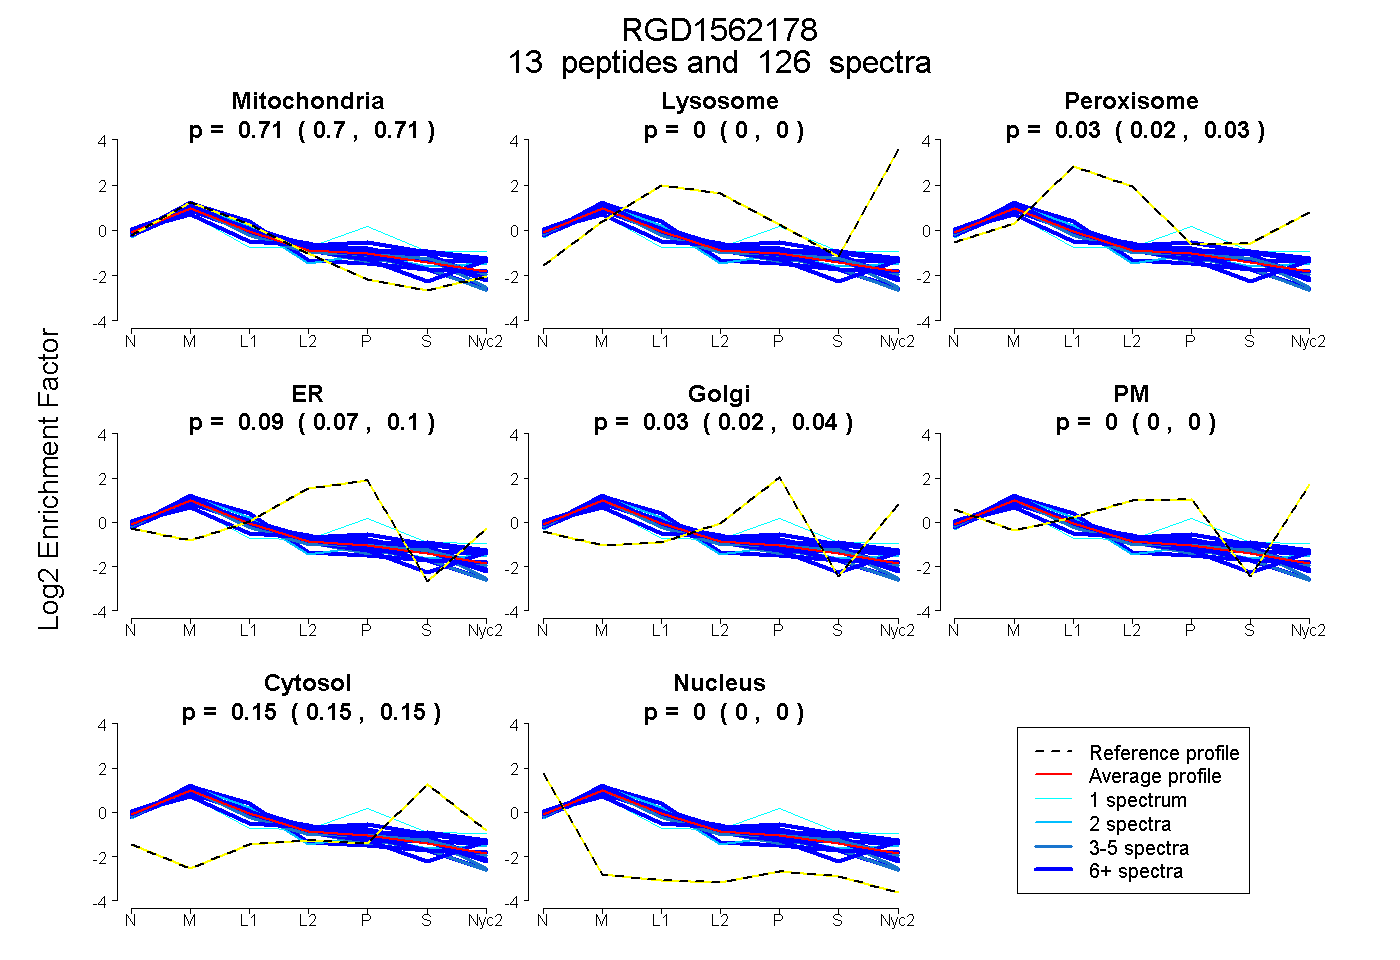
0.705 | 0.711
0.000 | 0.000
0.021 | 0.030
0.073 | 0.096
0.019 | 0.041
0.000 | 0.000
0.146 | 0.152
0.000 | 0.000
13peptides
spectra
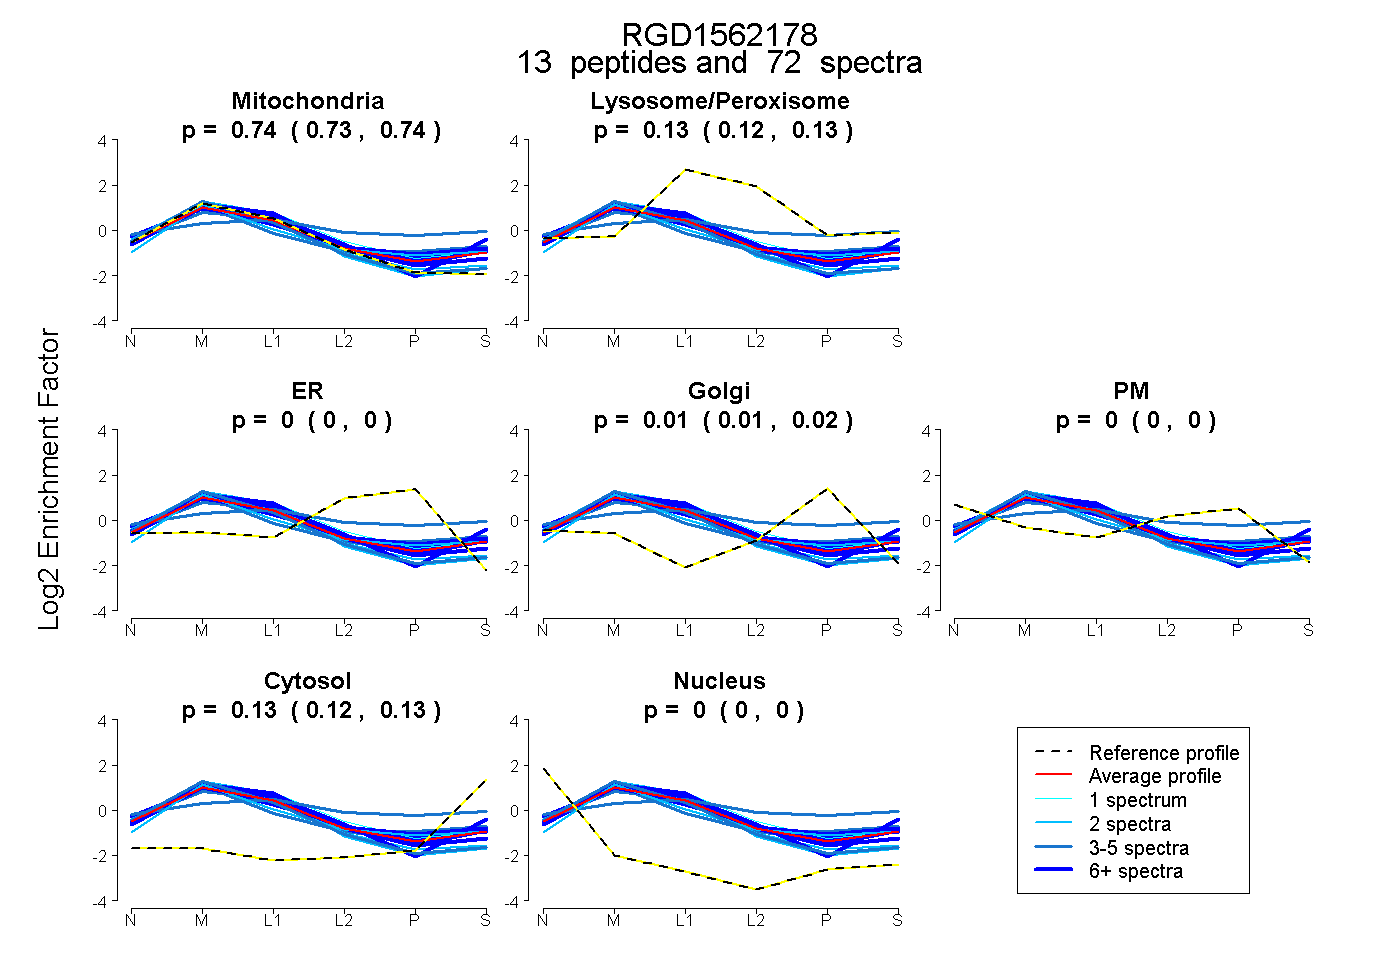
0.727 | 0.742
0.121 | 0.129
0.000 | 0.000
0.006 | 0.020
0.000 | 0.000
0.121 | 0.131
0.000 | 0.000
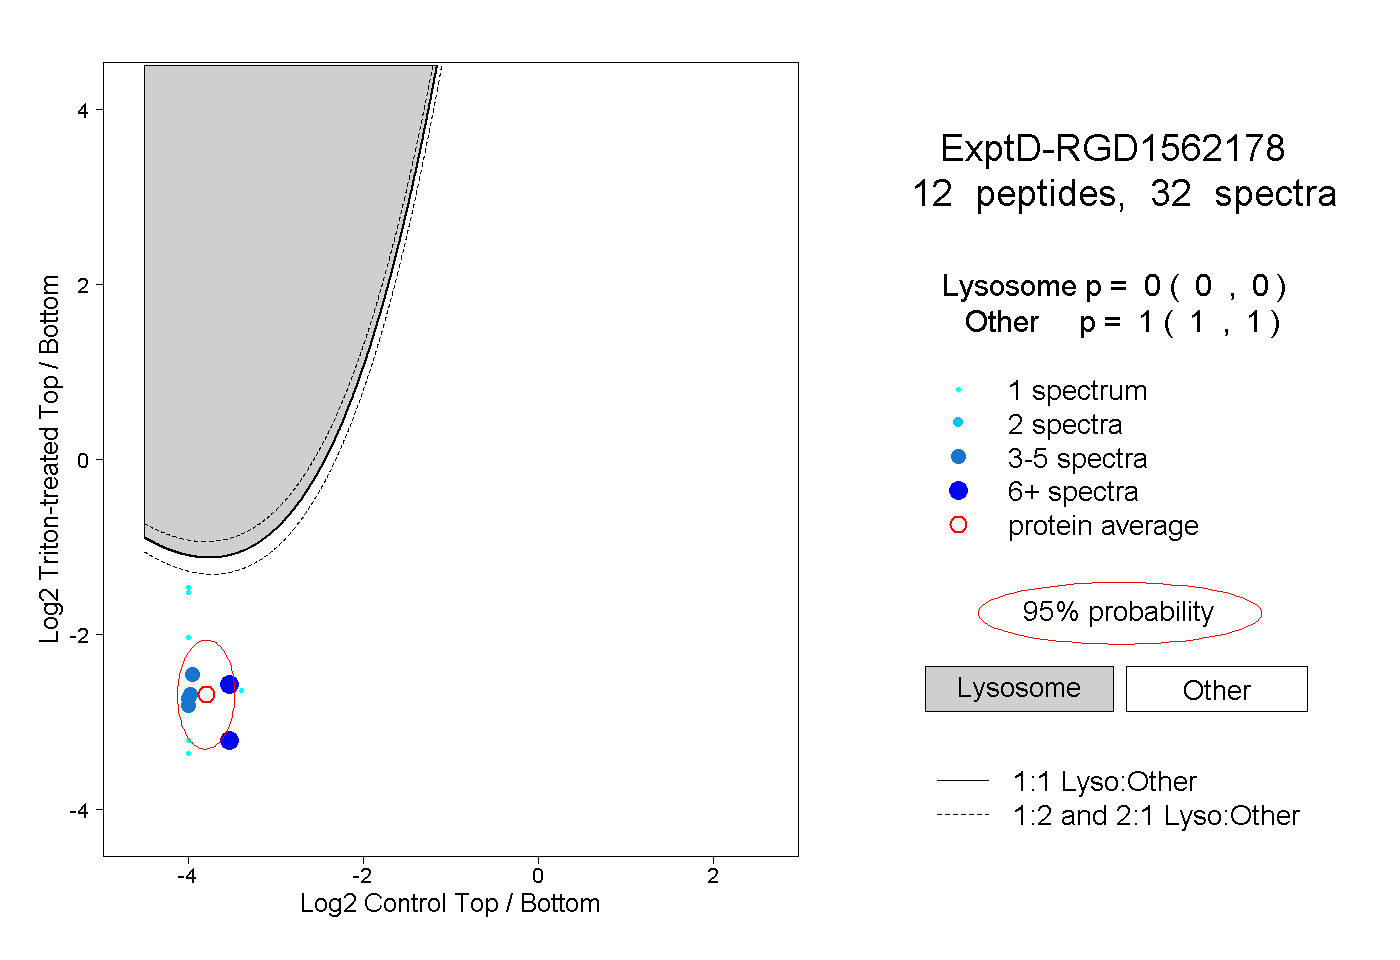
15peptides
spectra
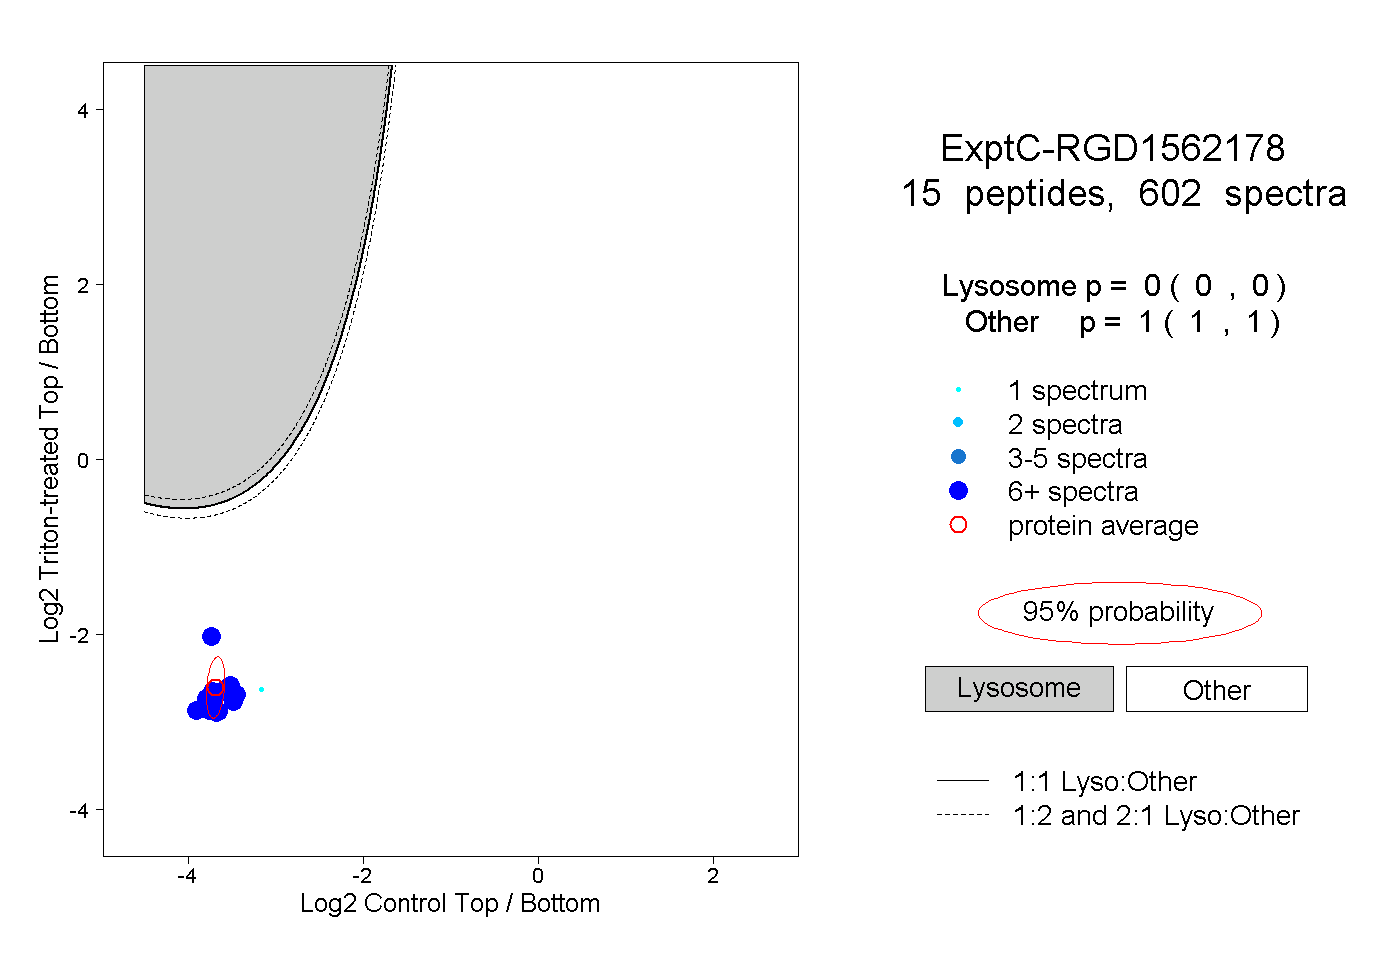
0.000 | 0.000
1.000 | 1.000