8
8peptides
spectra
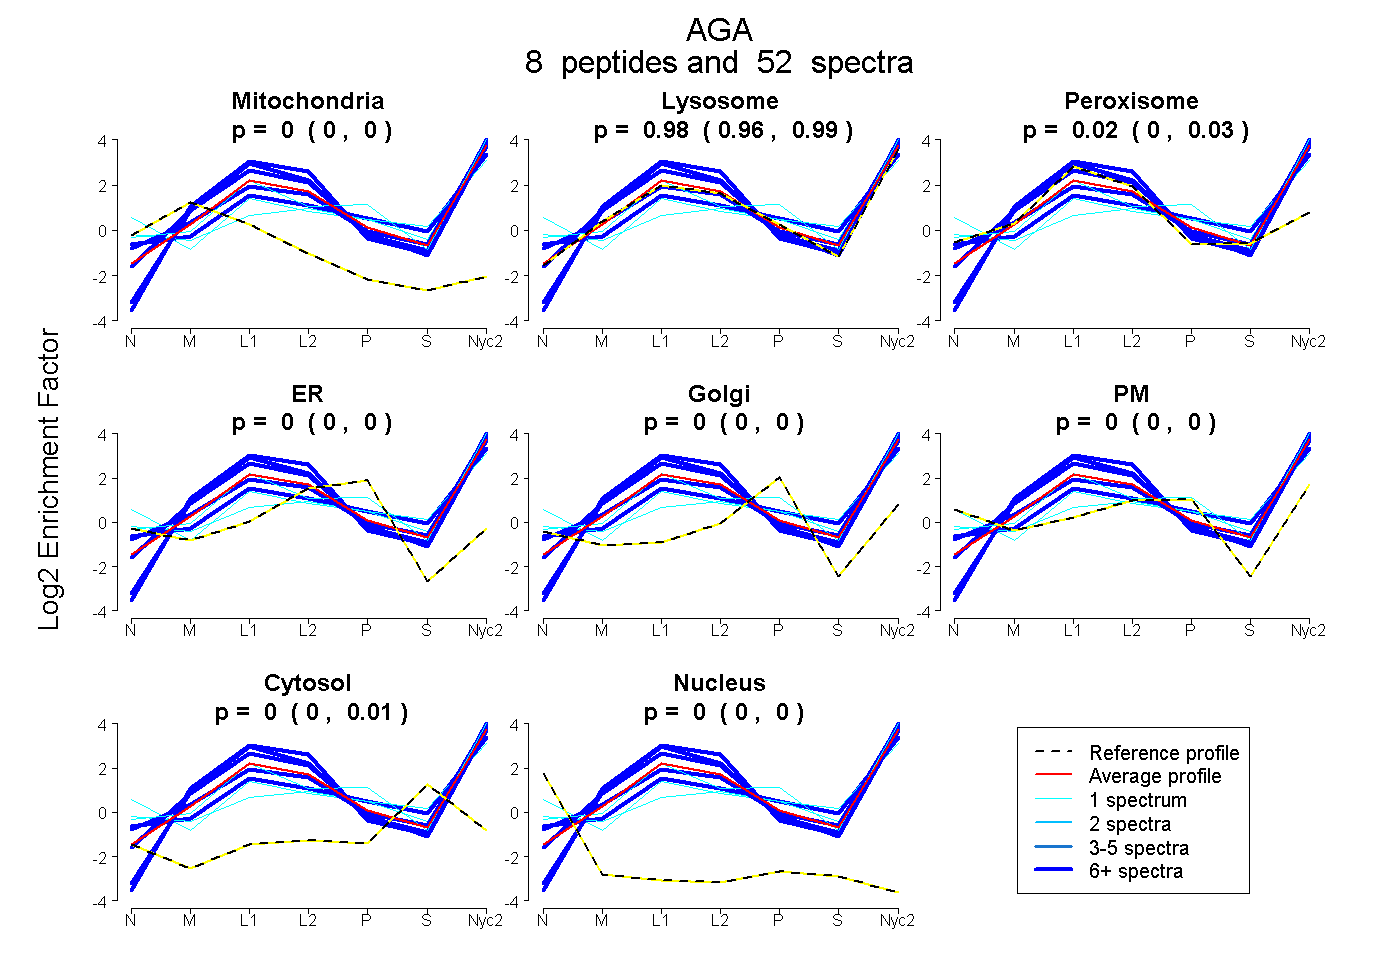
0.000 | 0.000
0.965 | 0.995
0.000 | 0.033
0.000 | 0.000
0.000 | 0.000
0.000 | 0.000
0.000 | 0.007
0.000 | 0.000
7peptides
spectra
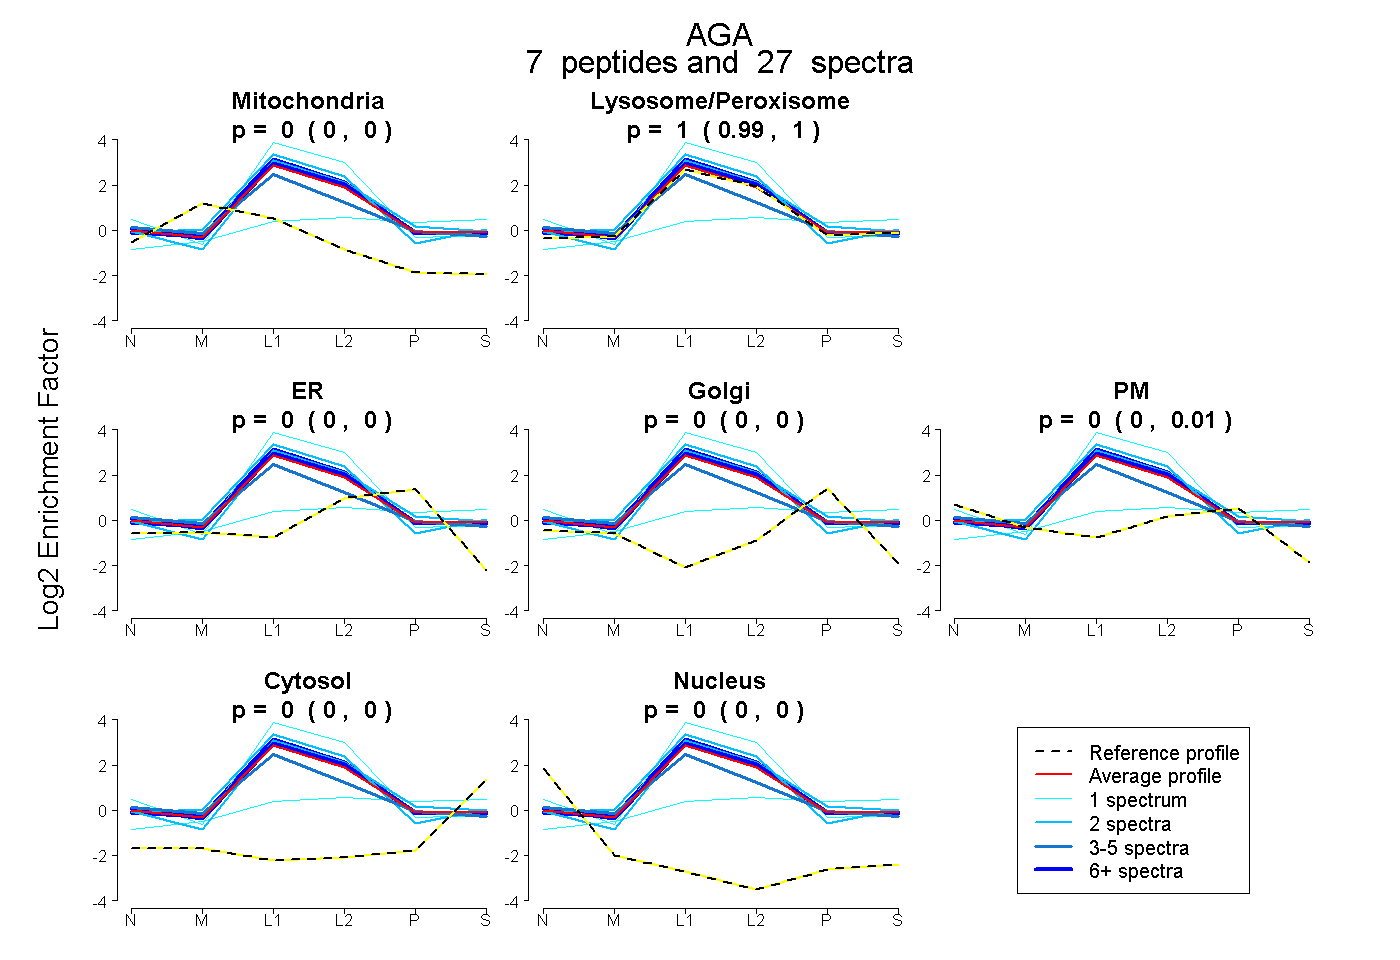
0.000 | 0.000
0.992 | 1.000
0.000 | 0.000
0.000 | 0.000
0.000 | 0.005
0.000 | 0.000
0.000 | 0.001
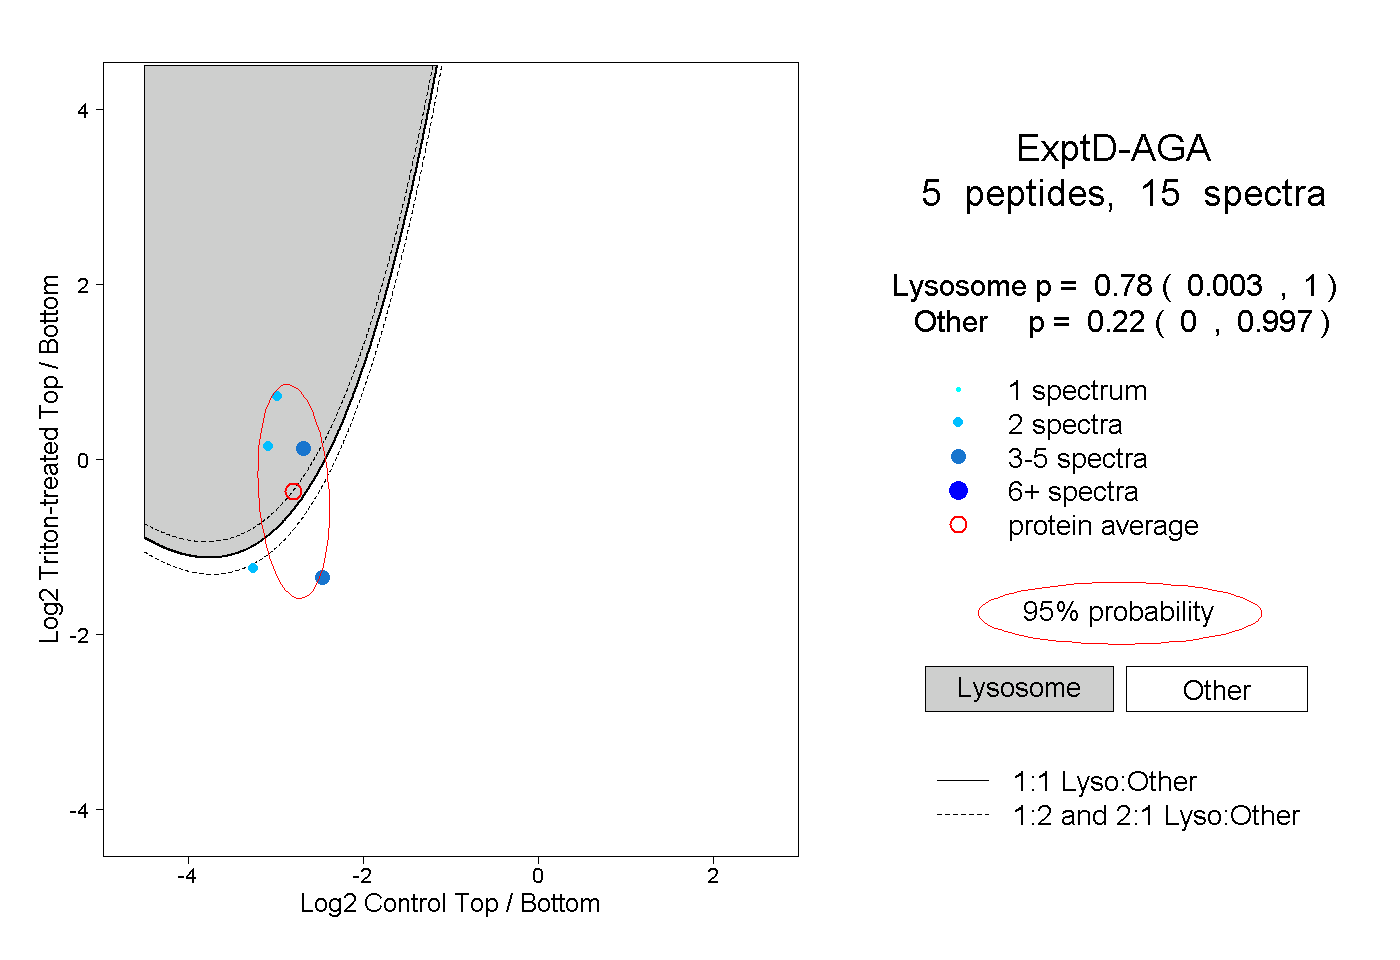
7peptides
spectra
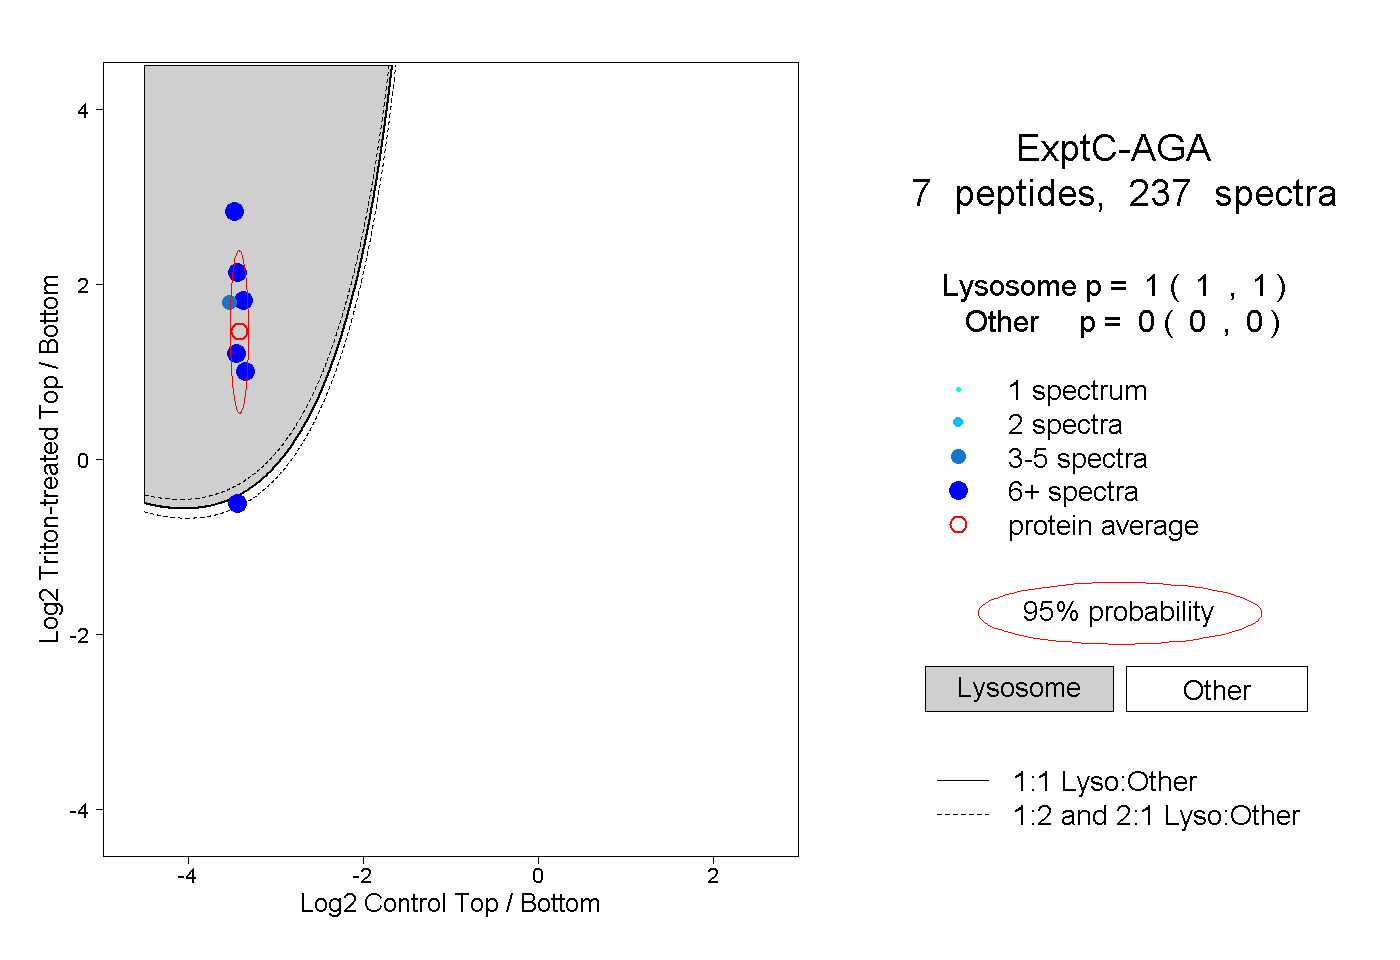
1.000 | 1.000
0.000 | 0.000