 8
8peptides
spectra
0.000 | 0.000
0.965 | 0.995
0.000 | 0.033
0.000 | 0.000
0.000 | 0.000
0.000 | 0.000
0.000 | 0.007
0.000 | 0.000
| Plot | Mito | Lyso | Perox | ER | Golgi | PM | Cytosol | Nucleus | |||||
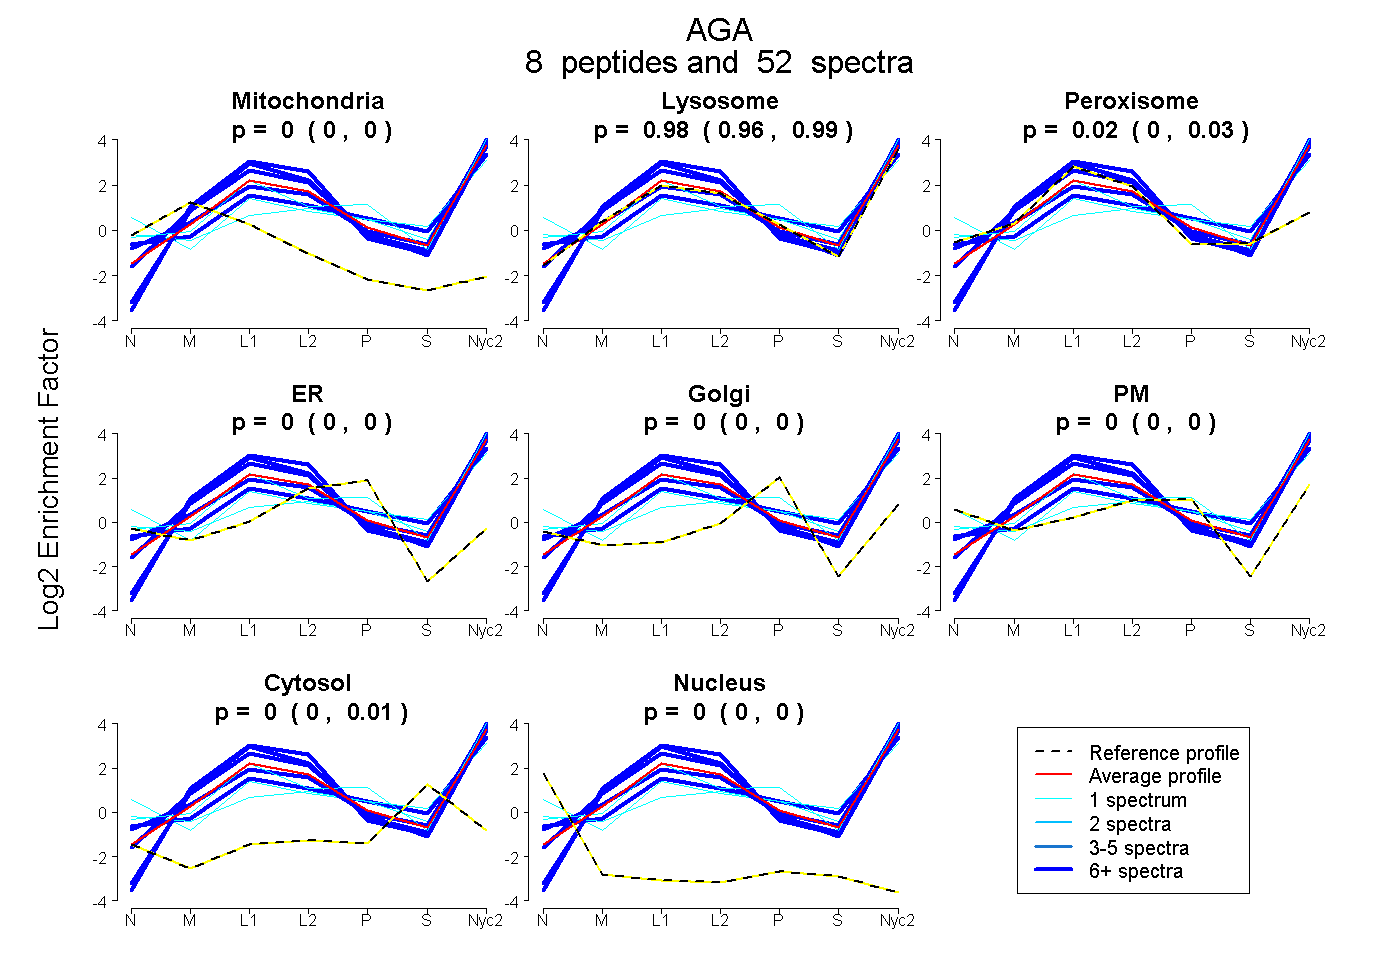
| Expt A |
8 peptides |
52 spectra |
|
0.000 0.000 | 0.000 |
0.981 0.965 | 0.995 |
0.019 0.000 | 0.033 |
0.000 0.000 | 0.000 |
0.000 0.000 | 0.000 |
0.000 0.000 | 0.000 |
0.000 0.000 | 0.007 |
0.000 0.000 | 0.000 |
| 1 spectrum, TGHTAAGTSTNGLK | 0.000 | 0.838 | 0.000 | 0.000 | 0.000 | 0.162 | 0.000 | 0.000 | ||
| 6 spectra, NVIPDPSK | 0.000 | 0.978 | 0.013 | 0.000 | 0.000 | 0.000 | 0.009 | 0.000 | ||
| 18 spectra, NAIGVAR | 0.000 | 1.000 | 0.000 | 0.000 | 0.000 | 0.000 | 0.000 | 0.000 | ||
| 1 spectrum, GGDDPAR | 0.000 | 0.610 | 0.000 | 0.000 | 0.000 | 0.327 | 0.063 | 0.000 | ||
| 7 spectra, FLPSYQAVEYMR | 0.000 | 1.000 | 0.000 | 0.000 | 0.000 | 0.000 | 0.000 | 0.000 | ||
| 1 spectrum, GCAMCEK | 0.000 | 0.609 | 0.000 | 0.000 | 0.000 | 0.194 | 0.197 | 0.000 | ||
| 9 spectra, NCQPNYWR | 0.000 | 0.952 | 0.048 | 0.000 | 0.000 | 0.000 | 0.000 | 0.000 | ||
| 9 spectra, ALHSDWLSR | 0.000 | 0.807 | 0.000 | 0.000 | 0.000 | 0.063 | 0.130 | 0.000 |
| Plot | Mito | Lyso or Perox | ER | Golgi | PM | Cytosol | Nucleus | ||||||
| Expt B |
7 peptides |
27 spectra |
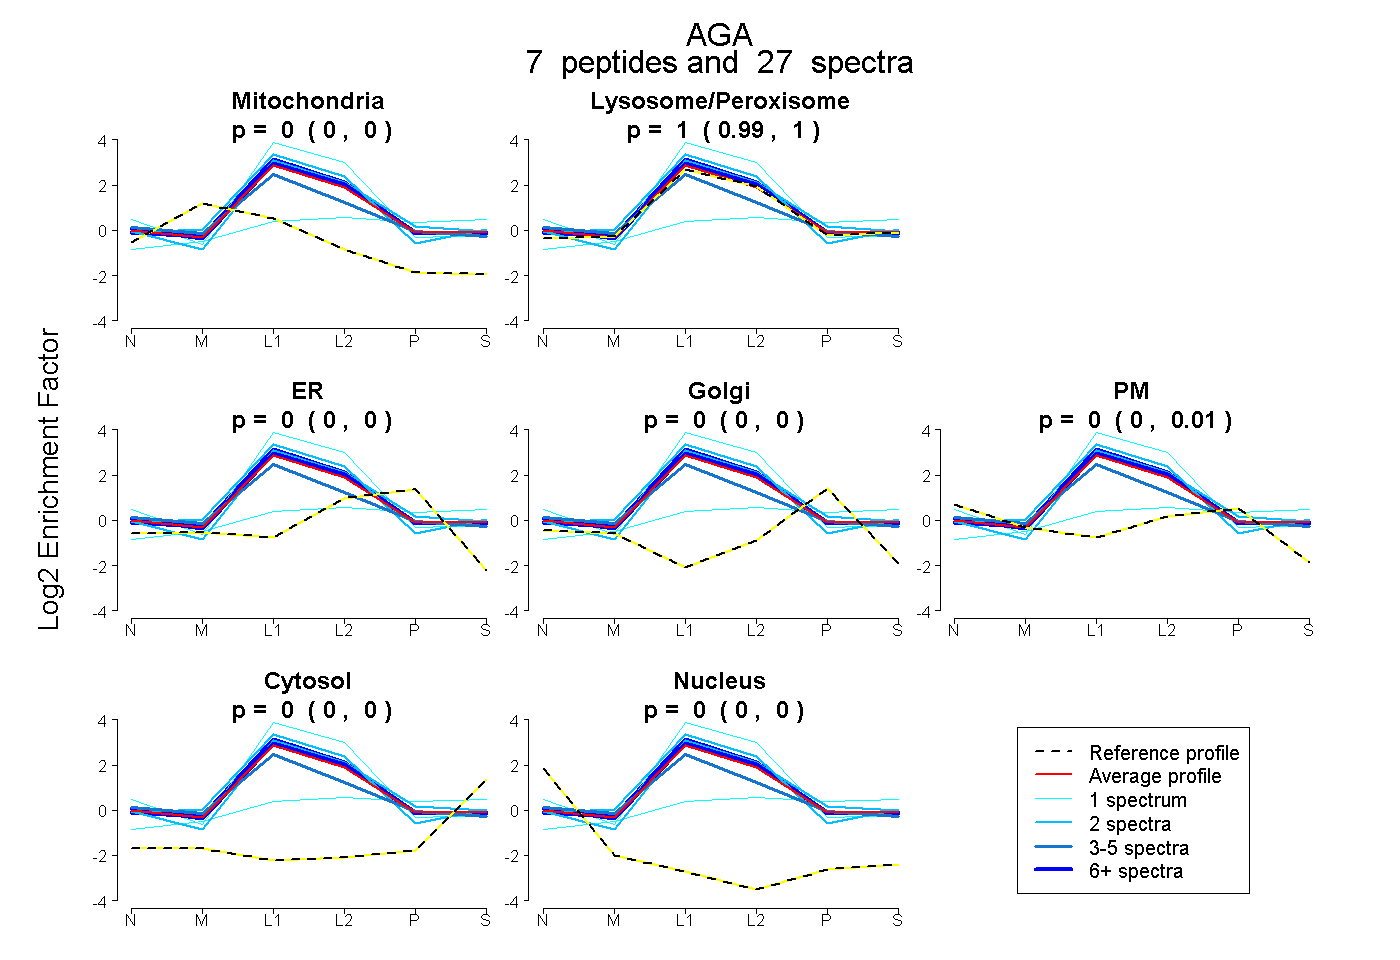 |
0.000 0.000 | 0.000 |
1.000 0.992 | 1.000 |
0.000 0.000 | 0.000 |
0.000 0.000 | 0.000 |
0.000 0.000 | 0.005 |
0.000 0.000 | 0.000 |
0.000 0.000 | 0.001 |
|||
| Plot | Lyso | Other | |||||||||||
| Expt C |
7 peptides |
237 spectra |
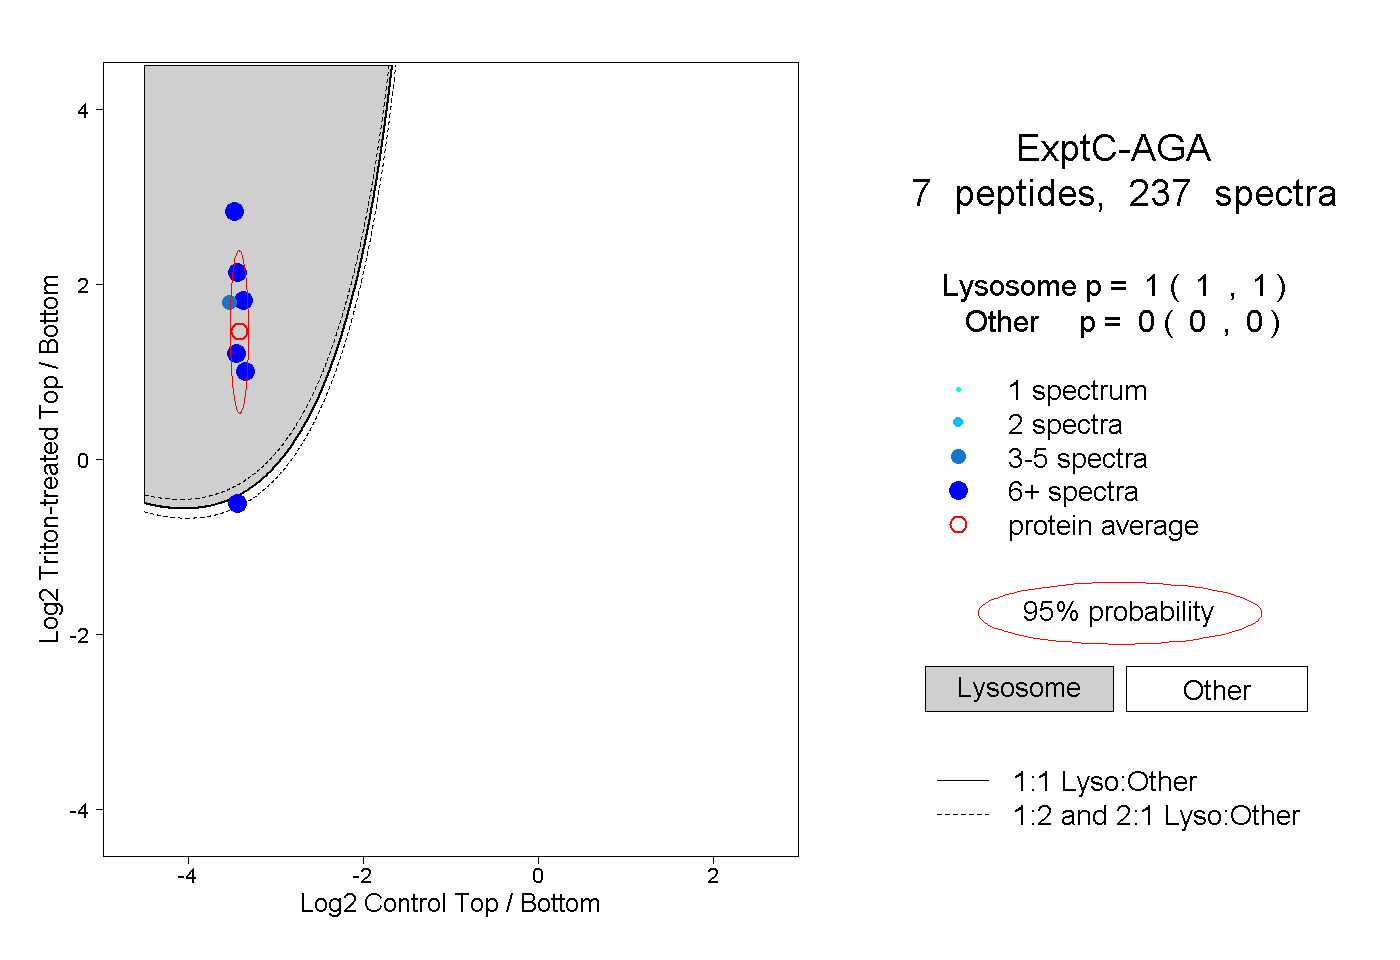 |
1.000 1.000 | 1.000 |
0.000 0.000 | 0.000 |
||||||||
| Plot | Lyso | Other | |||||||||||
| Expt D |
5 peptides |
15 spectra |
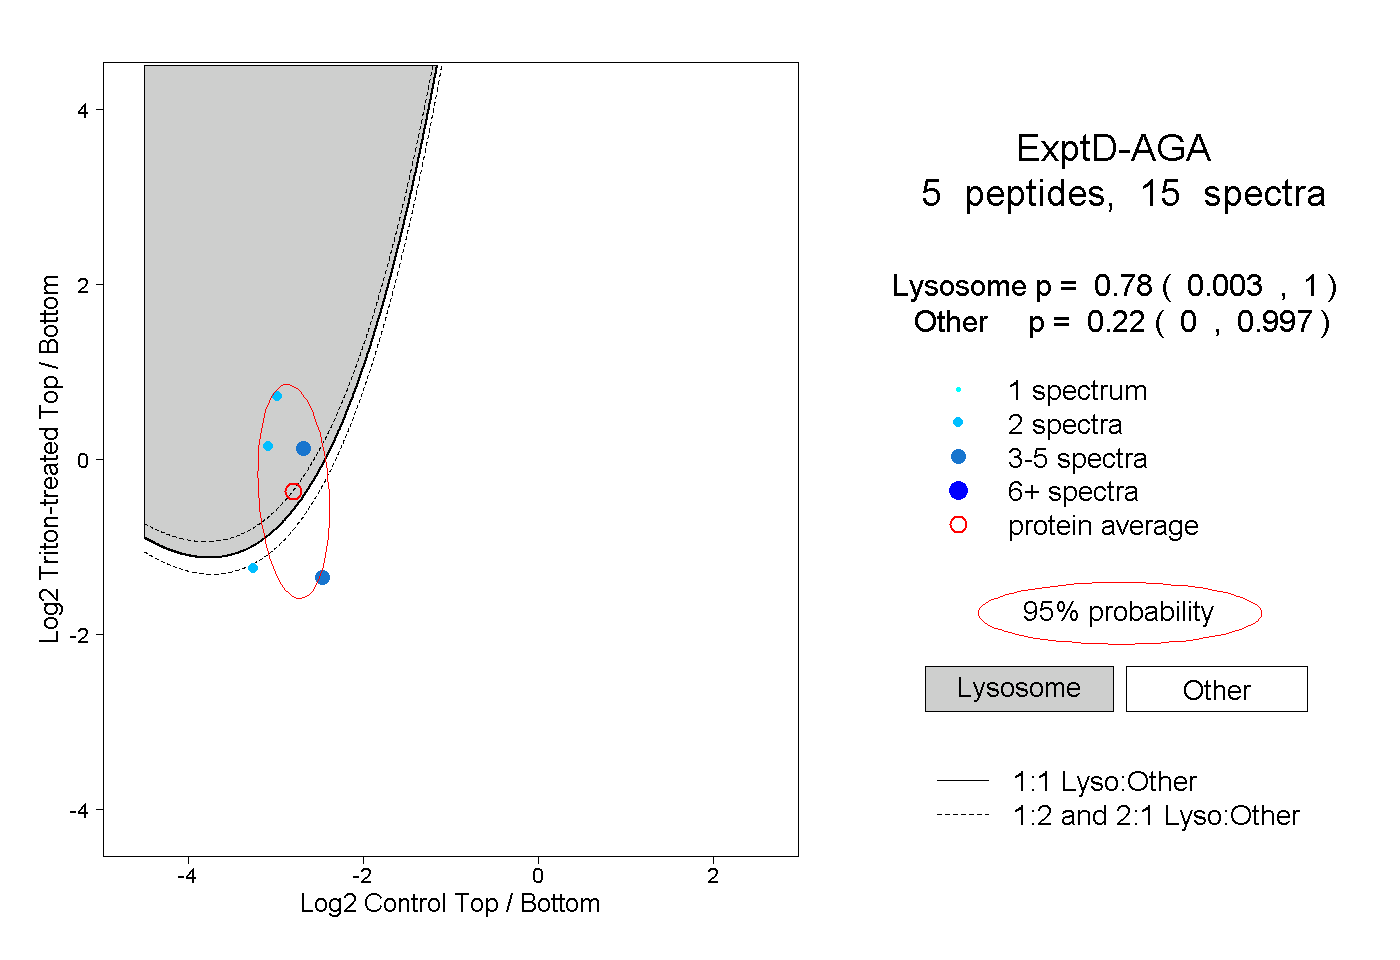 |
0.780 0.003 | 1.000 |
0.220 0.000 | 0.997 |