 4
4peptides
spectra
0.000 | 0.000
0.000 | 0.023
0.119 | 0.194
0.000 | 0.086
0.000 | 0.095
0.000 | 0.062
0.723 | 0.784
0.000 | 0.000
1peptide
spectra
NA | NA
NA | NA
NA | NA
NA | NA
NA | NA
NA | NA
NA | NA
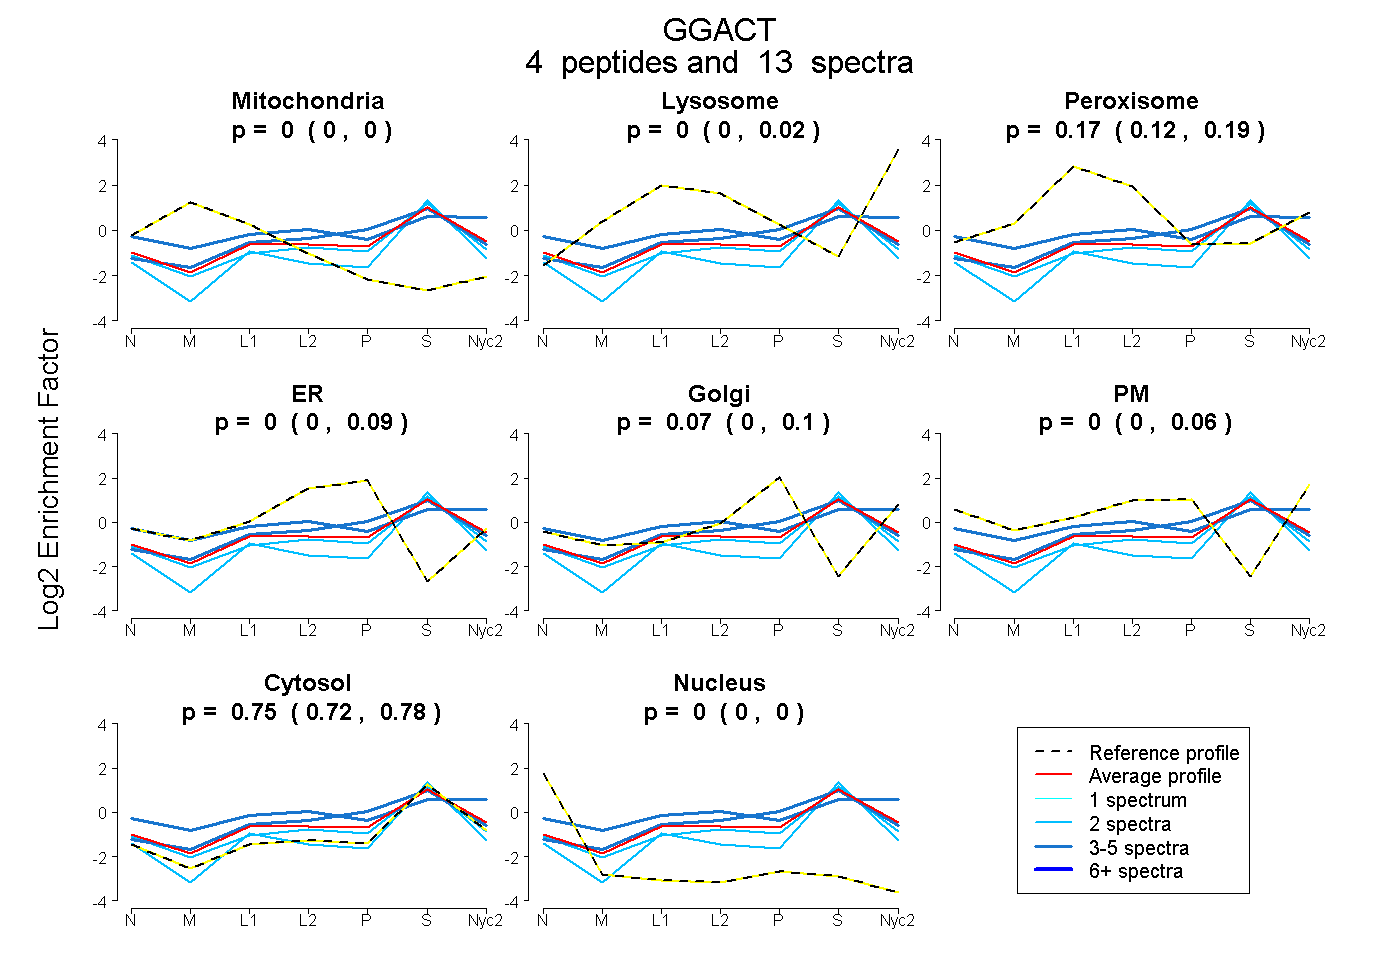
| Plot | Mito | Lyso | Perox | ER | Golgi | PM | Cytosol | Nucleus | |||||
| Expt A |
4 peptides |
13 spectra |
|
0.000 0.000 | 0.000 |
0.000 0.000 | 0.023 |
0.173 0.119 | 0.194 |
0.004 0.000 | 0.086 |
0.070 0.000 | 0.095 |
0.000 0.000 | 0.062 |
0.753 0.723 | 0.784 |
0.000 0.000 | 0.000 |
||
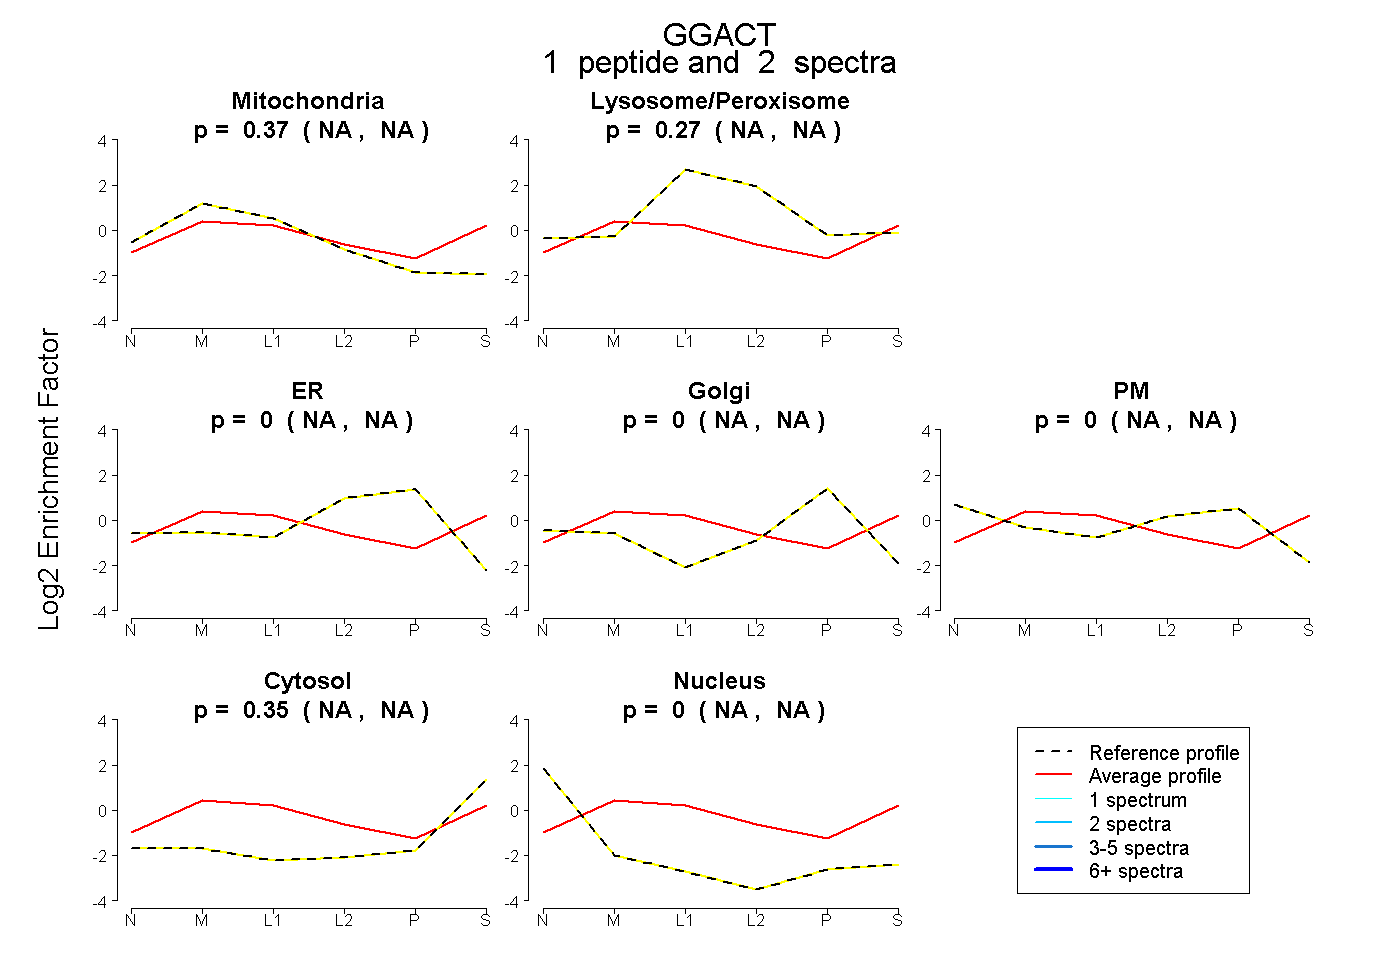
| Plot | Mito | Lyso or Perox | ER | Golgi | PM | Cytosol | Nucleus | ||||||
| Expt B |
1 peptide |
2 spectra |
|
0.375 NA | NA |
0.275 NA | NA |
0.000 NA | NA |
0.000 NA | NA |
0.000 NA | NA |
0.350 NA | NA |
0.000 NA | NA |