 3
3peptides
spectra
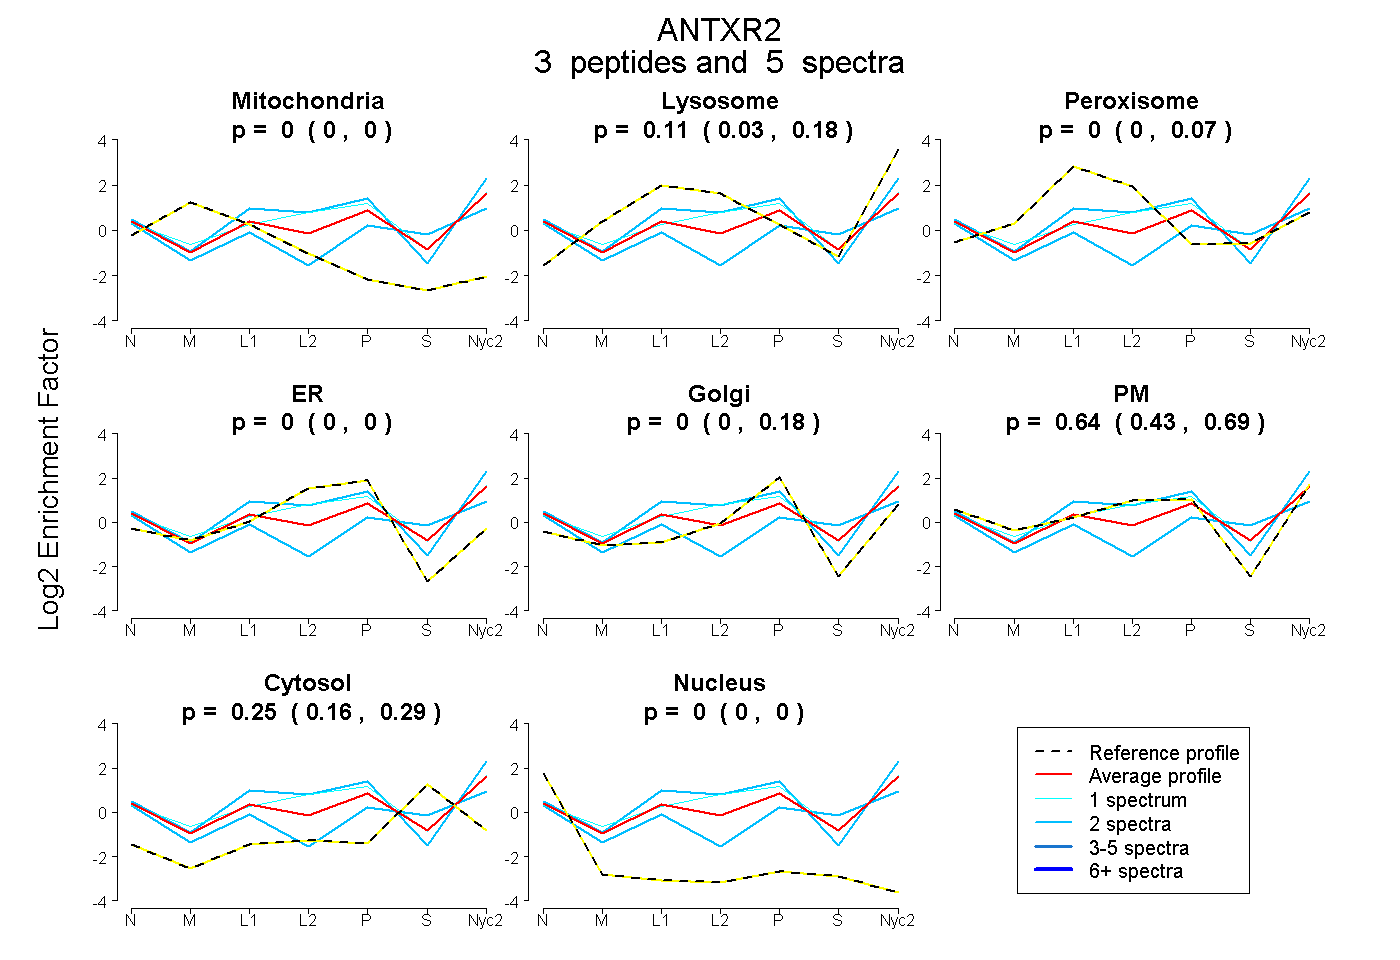
0.000 | 0.000
0.030 | 0.179
0.000 | 0.068
0.000 | 0.000
0.000 | 0.181
0.430 | 0.685
0.164 | 0.294
0.000 | 0.000
| Plot | Mito | Lyso | Perox | ER | Golgi | PM | Cytosol | Nucleus | |||||
| Expt A |
3 peptides |
5 spectra |
|
0.000 0.000 | 0.000 |
0.109 0.030 | 0.179 |
0.000 0.000 | 0.068 |
0.000 0.000 | 0.000 |
0.000 0.000 | 0.181 |
0.643 0.430 | 0.685 |
0.247 0.164 | 0.294 |
0.000 0.000 | 0.000 |
| 2 spectra, AFDLYFVLDK | 0.000 | 0.000 | 0.000 | 0.000 | 0.000 | 0.500 | 0.492 | 0.008 | ||
| 2 spectra, WPTVDASYYGGR | 0.000 | 0.215 | 0.000 | 0.000 | 0.016 | 0.730 | 0.039 | 0.000 | ||
| 1 spectrum, WYTPIK | 0.000 | 0.144 | 0.017 | 0.000 | 0.020 | 0.658 | 0.161 | 0.000 |
| Plot | Lyso | Other | |||||||||||
| Expt C |
5 peptides |
10 spectra |
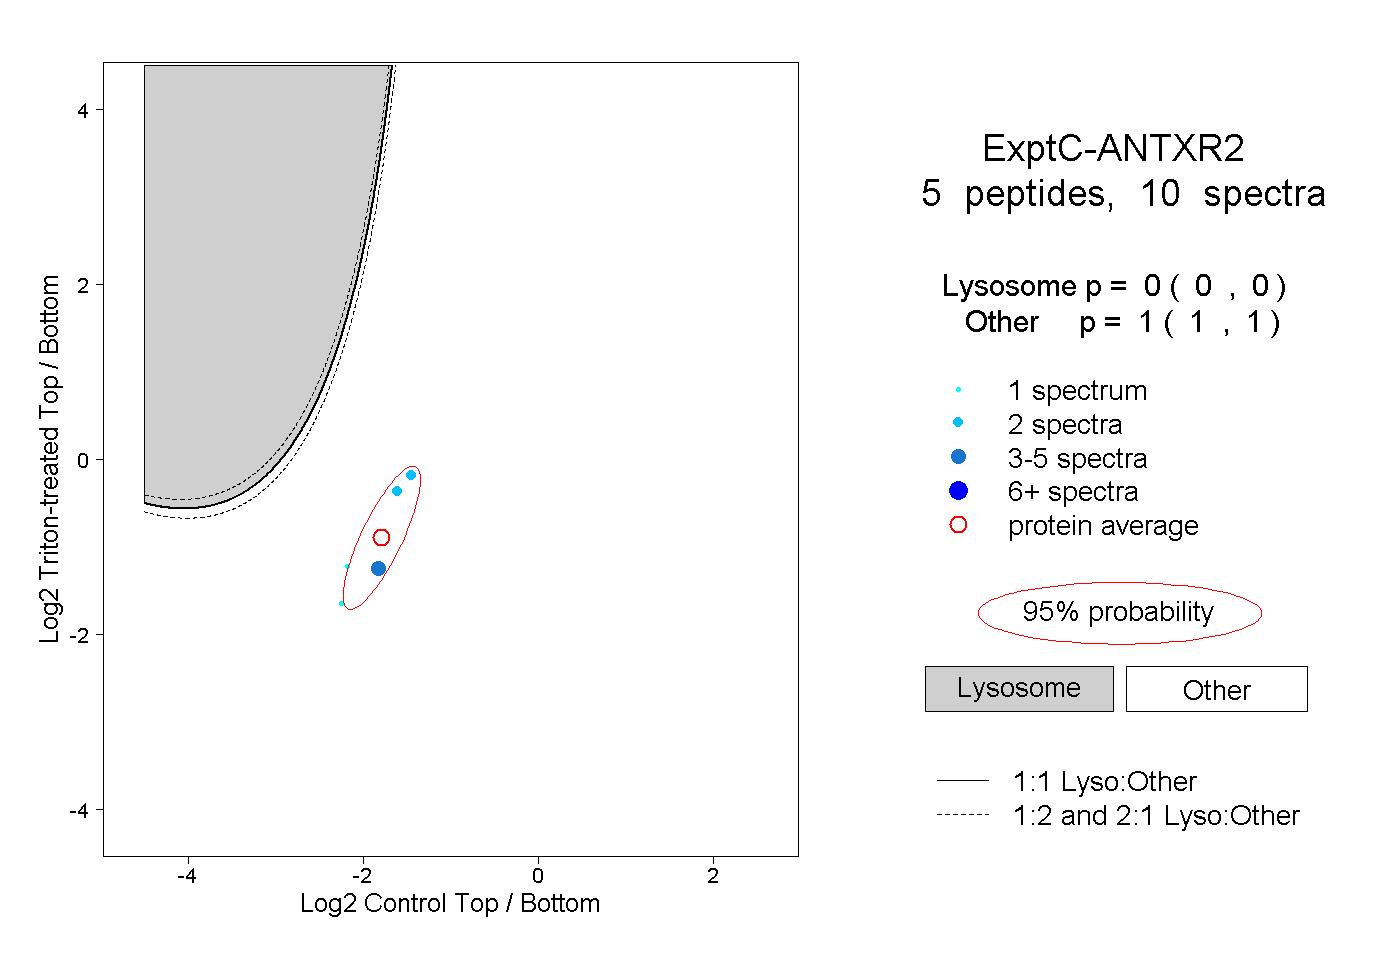 |
0.000 0.000 | 0.000 |
1.000 1.000 | 1.000 |