 5
5peptides
spectra
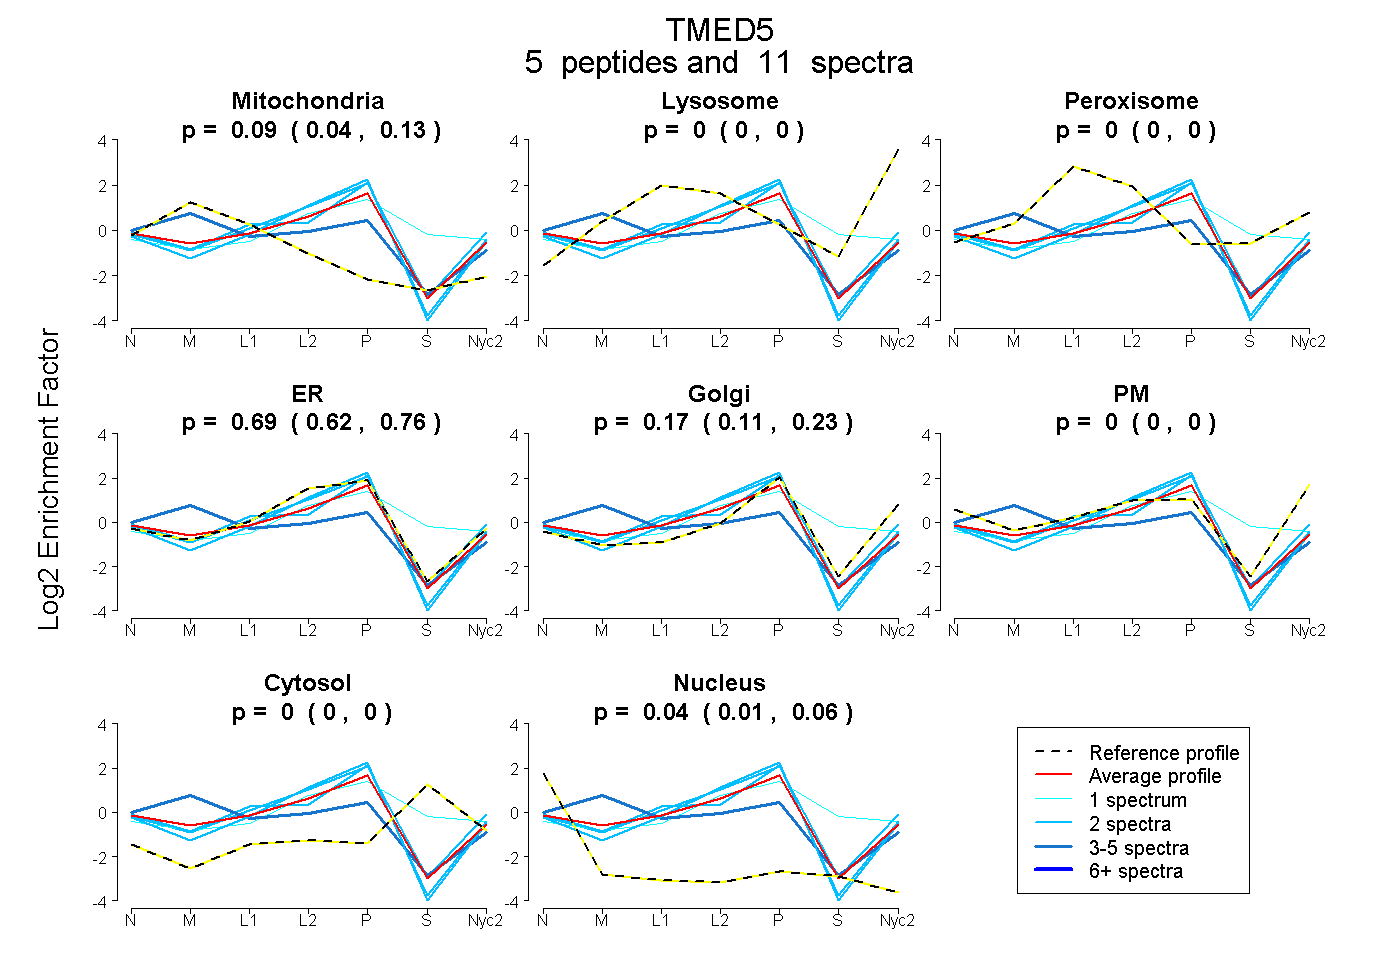
0.044 | 0.133
0.000 | 0.000
0.000 | 0.000
0.621 | 0.755
0.107 | 0.227
0.000 | 0.000
0.000 | 0.000
0.011 | 0.064
3peptides
spectra
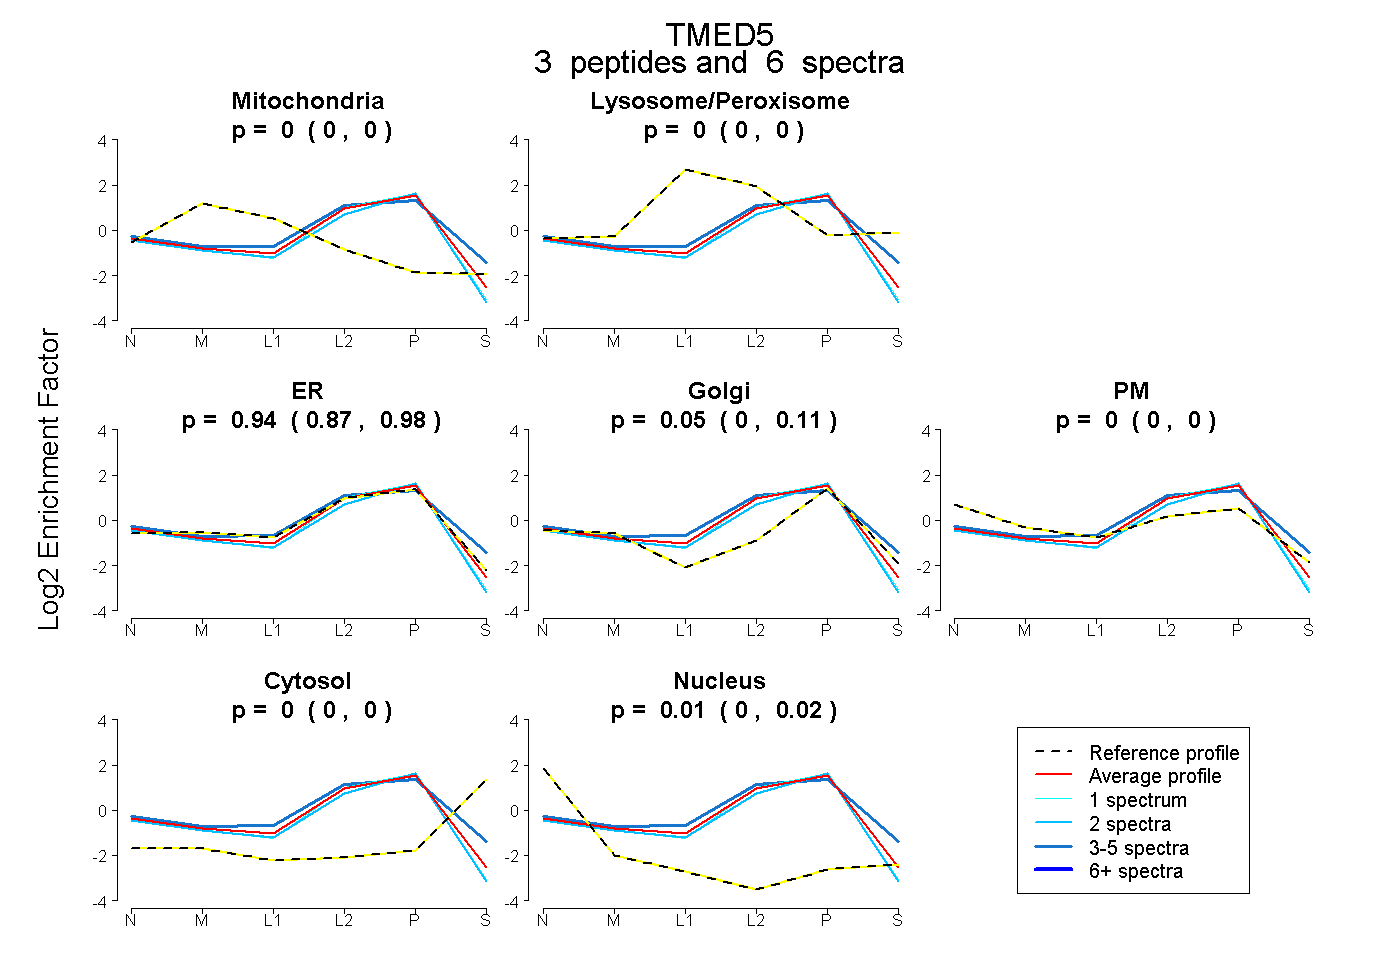
0.000 | 0.000
0.000 | 0.000
0.874 | 0.983
0.000 | 0.113
0.000 | 0.000
0.000 | 0.000
0.000 | 0.024
7peptides
spectra
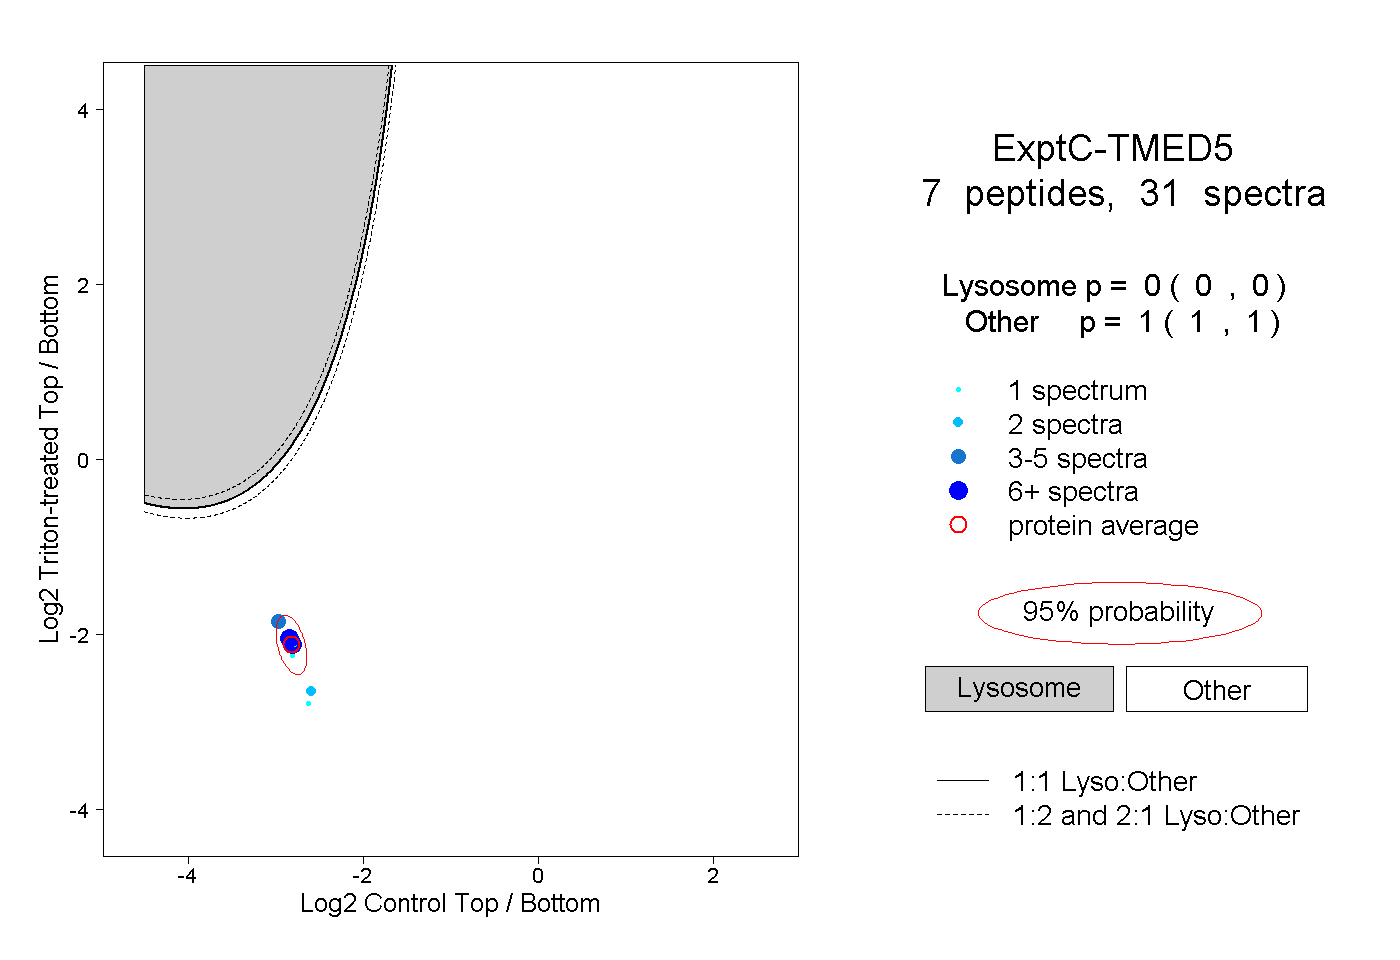
0.000 | 0.000
1.000 | 1.000
3peptides
spectra
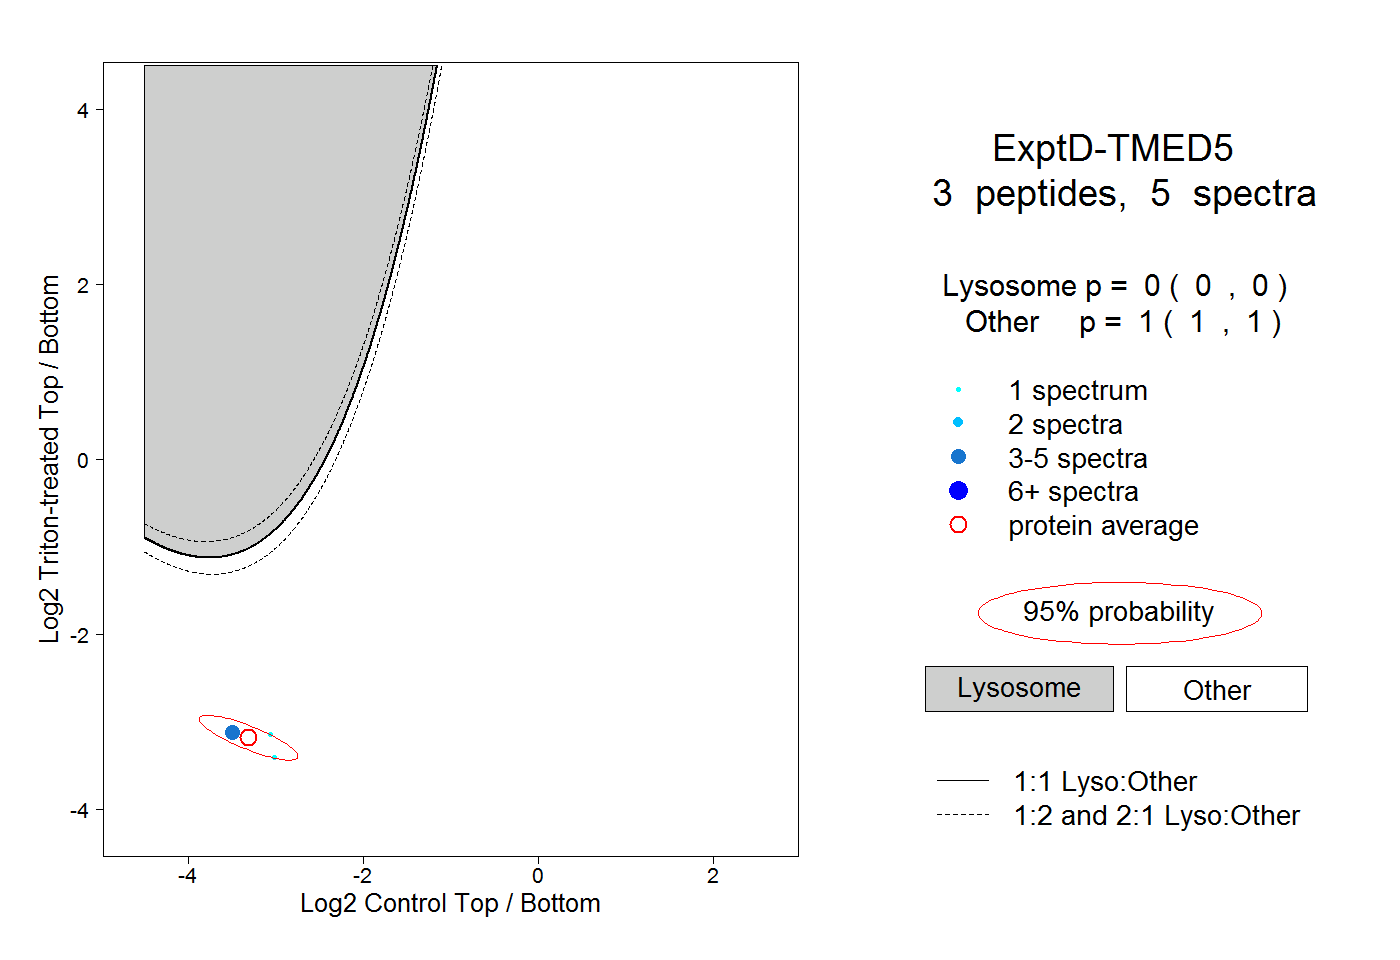
0.000 | 0.000
1.000 | 1.000