 8
8peptides
spectra
0.297 | 0.316
0.000 | 0.000
0.000 | 0.000
0.000 | 0.000
0.000 | 0.000
0.000 | 0.000
0.598 | 0.622
0.066 | 0.095
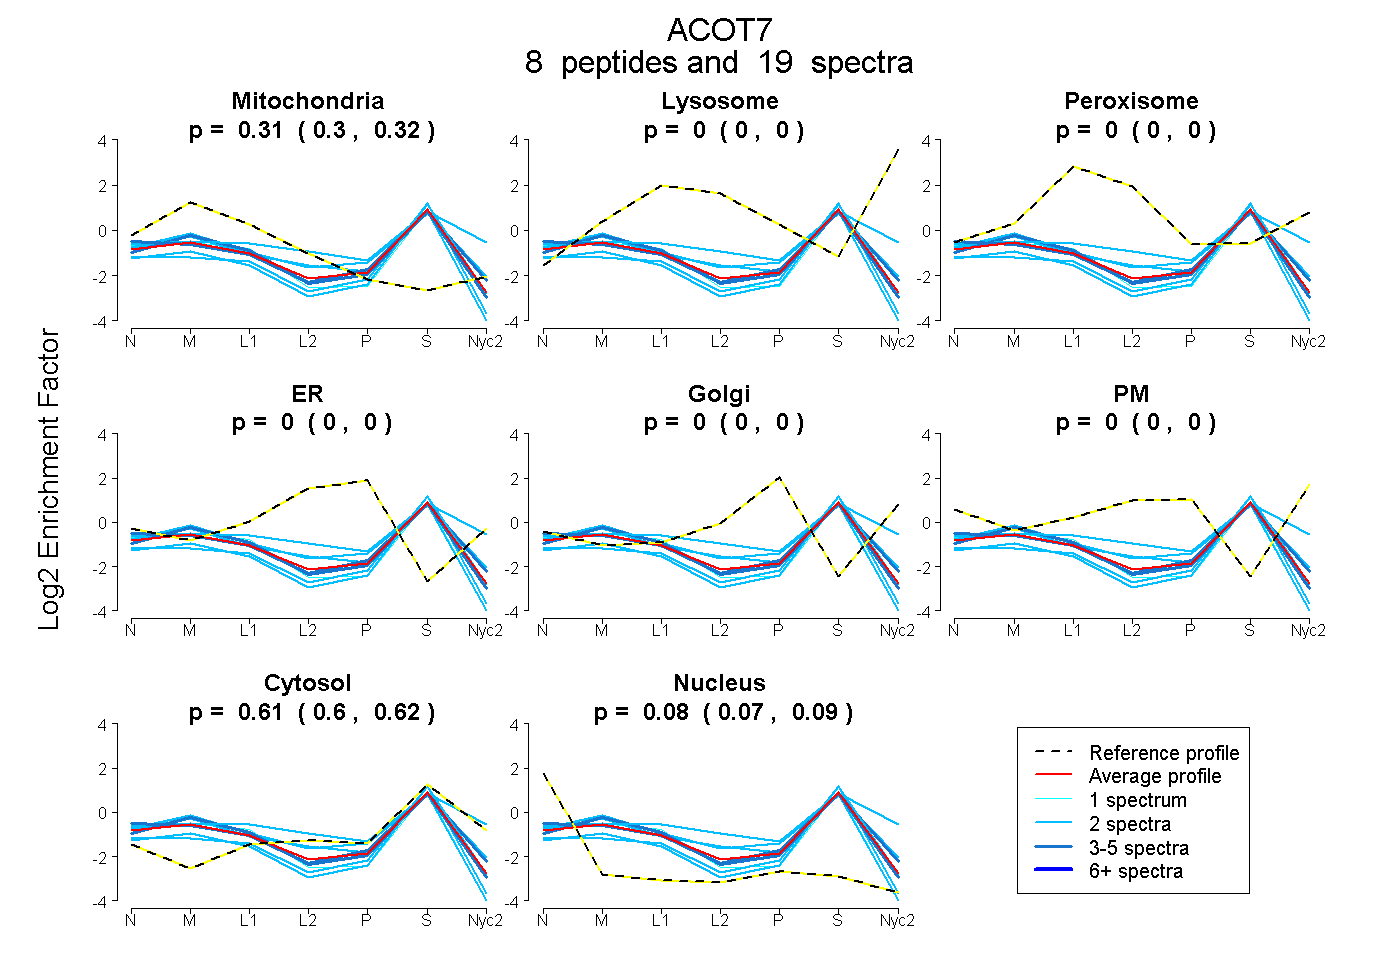
| Plot | Mito | Lyso | Perox | ER | Golgi | PM | Cytosol | Nucleus | |||||
| Expt A |
8 peptides |
19 spectra |
|
0.308 0.297 | 0.316 |
0.000 0.000 | 0.000 |
0.000 0.000 | 0.000 |
0.000 0.000 | 0.000 |
0.000 0.000 | 0.000 |
0.000 0.000 | 0.000 |
0.610 0.598 | 0.622 |
0.082 0.066 | 0.095 |
| 4 spectra, LMDEVAGIVAAR | 0.364 | 0.000 | 0.000 | 0.000 | 0.000 | 0.000 | 0.615 | 0.021 | ||
| 2 spectra, CVAALAR | 0.388 | 0.000 | 0.000 | 0.000 | 0.000 | 0.000 | 0.612 | 0.000 | ||
| 2 spectra, GCVITISGR | 0.140 | 0.000 | 0.000 | 0.000 | 0.000 | 0.000 | 0.637 | 0.222 | ||
| 1 spectrum, ATLWYVPLSLK | 0.316 | 0.000 | 0.000 | 0.000 | 0.000 | 0.000 | 0.490 | 0.194 | ||
| 2 spectra, MTFTSNK | 0.158 | 0.000 | 0.000 | 0.000 | 0.000 | 0.000 | 0.671 | 0.171 | ||
| 4 spectra, VLEVPPIVYLR | 0.289 | 0.000 | 0.000 | 0.000 | 0.000 | 0.000 | 0.570 | 0.141 | ||
| 2 spectra, QGHTEPQP | 0.206 | 0.032 | 0.138 | 0.000 | 0.000 | 0.000 | 0.623 | 0.000 | ||
| 2 spectra, IMRPDDANVAGNVHGGTILK | 0.371 | 0.000 | 0.000 | 0.000 | 0.000 | 0.000 | 0.510 | 0.119 |
| Plot | Mito | Lyso or Perox | ER | Golgi | PM | Cytosol | Nucleus | ||||||
| Expt B |
1 peptide |
1 spectrum |
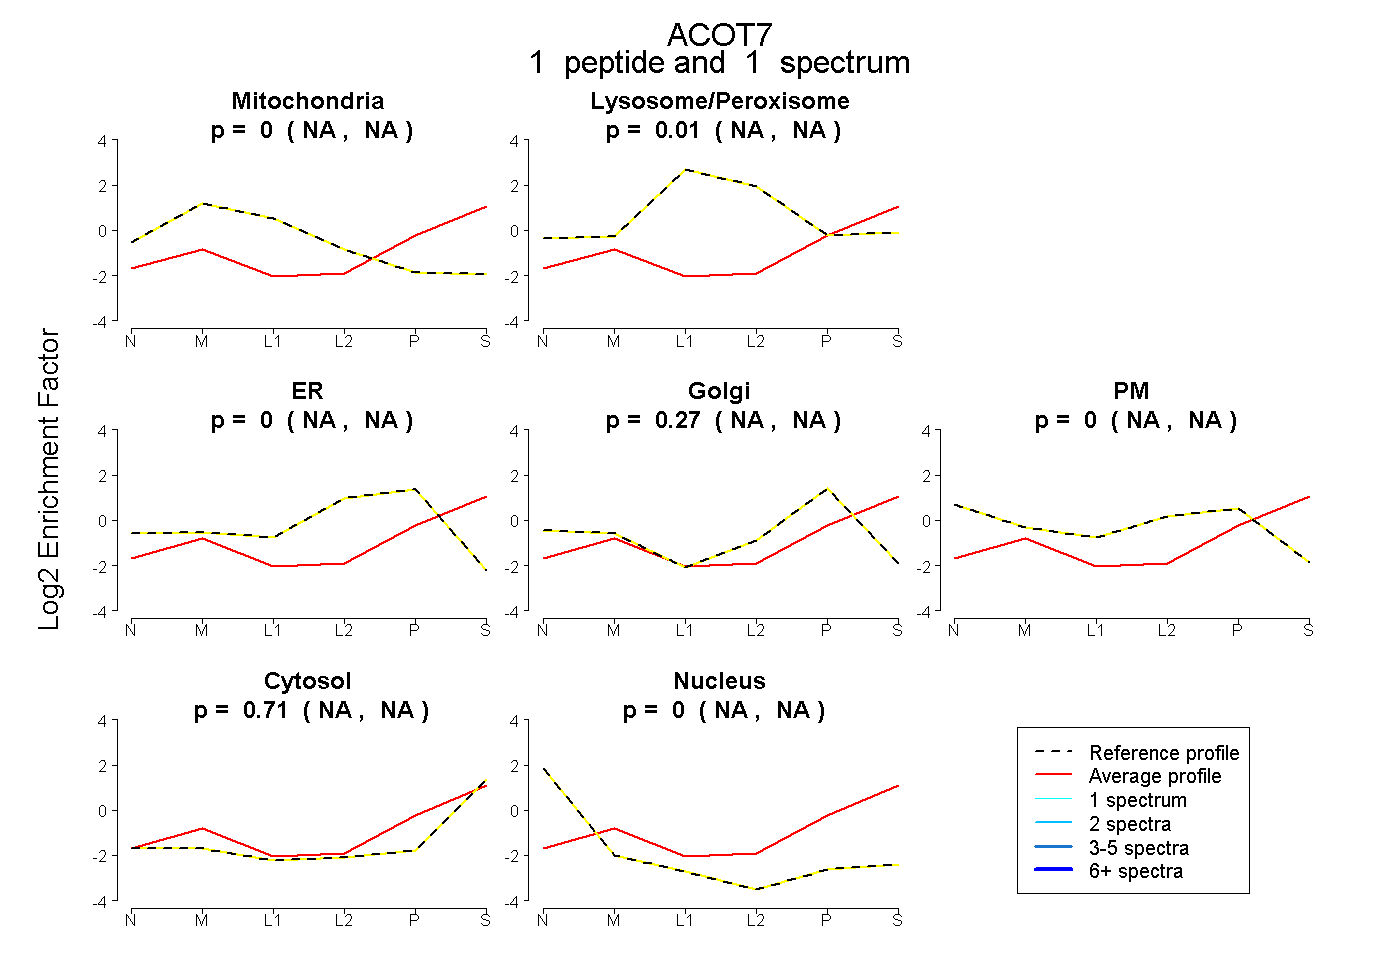 |
0.000 NA | NA |
0.014 NA | NA |
0.000 NA | NA |
0.271 NA | NA |
0.000 NA | NA |
0.715 NA | NA |
0.000 NA | NA |
|||
| Plot | Lyso | Other | |||||||||||
| Expt C |
5 peptides |
12 spectra |
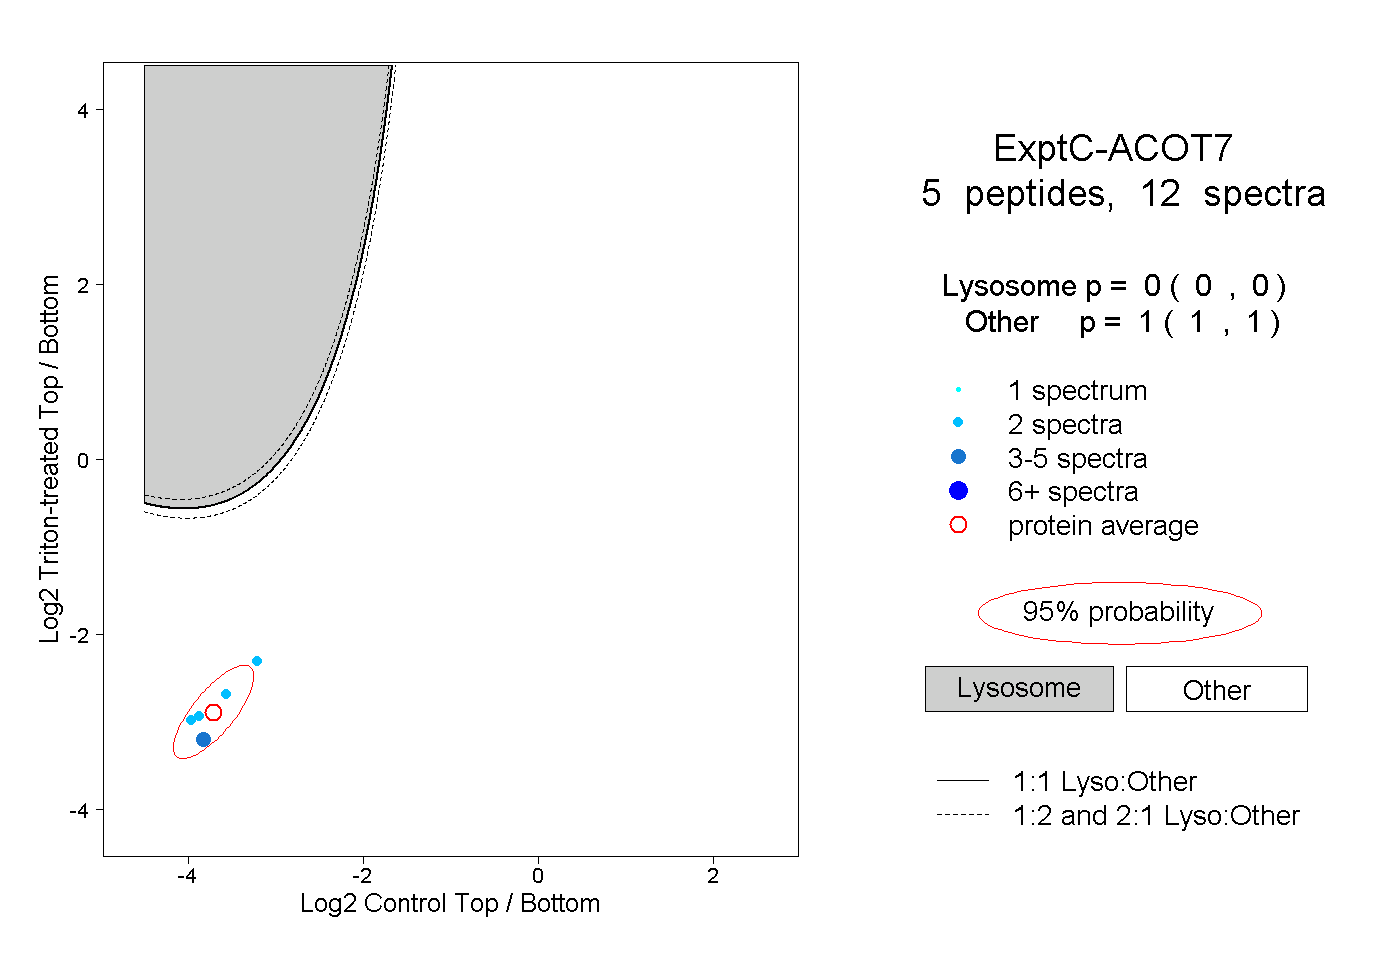 |
0.000 0.000 | 0.000 |
1.000 1.000 | 1.000 |