ATP5I
[ENSRNOP00000000072]
Main page
| | | Plot |
Mito |
Lyso |
|
Perox |
ER |
Golgi |
PM |
Cytosol |
Nucleus |
|
| Expt A |
 4
4
peptides |
39
spectra |
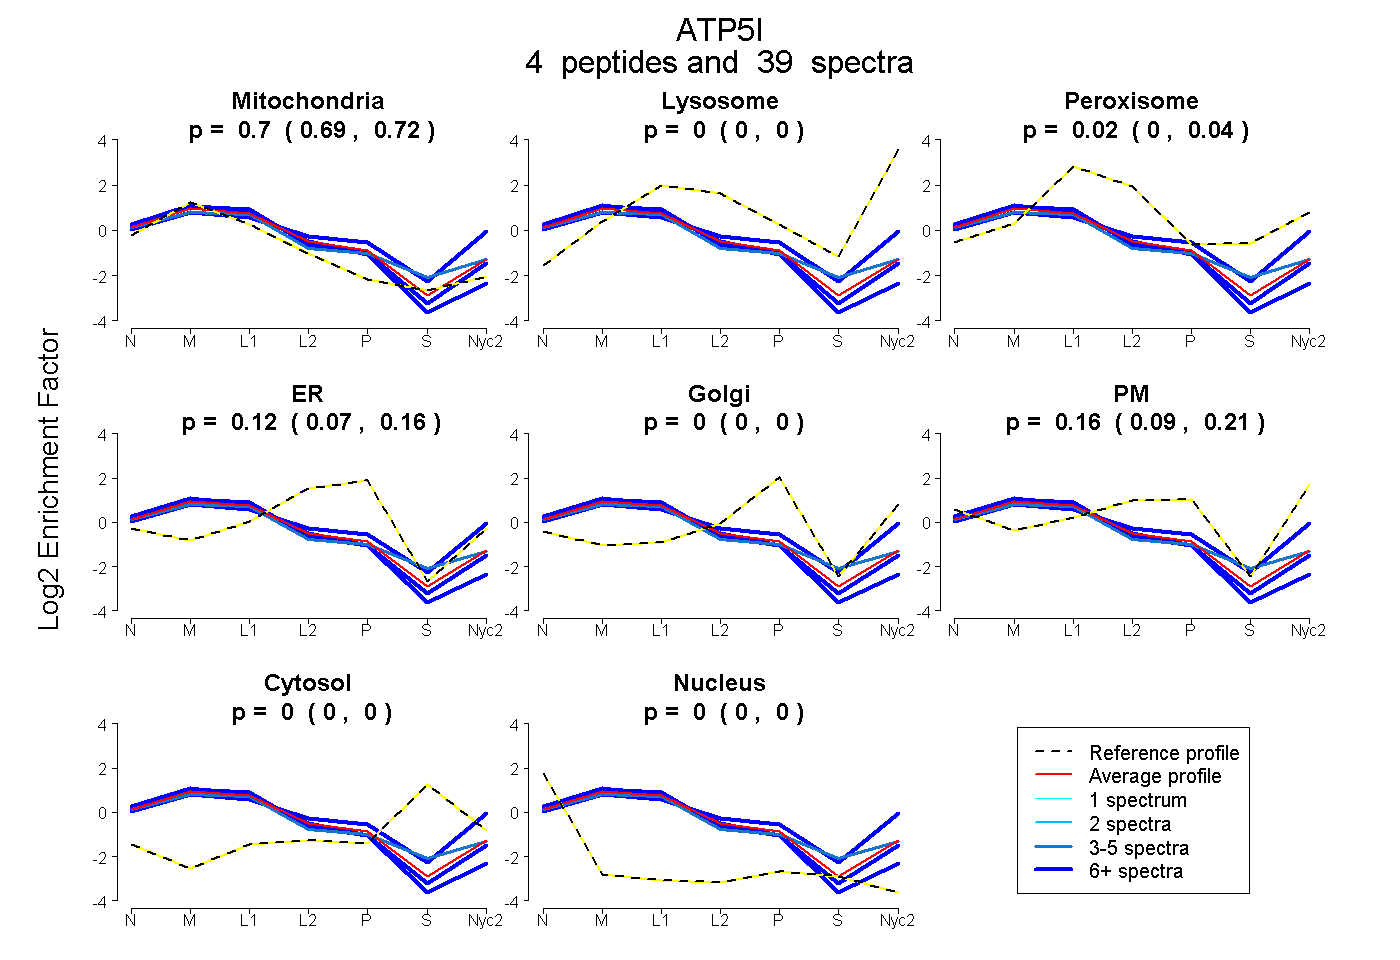 |
0.703
0.687 | 0.717 |
0.000
0.000 | 0.000 |
|
0.020
0.003 | 0.035 |
0.121
0.072 | 0.163 |
0.000
0.000 | 0.000 |
0.155
0.095 | 0.208 |
0.000
0.000 | 0.000 |
0.000
0.000 | 0.000 |
|
| | | Plot |
Mito |
|
Lyso or Perox |
|
ER |
Golgi |
PM |
Cytosol |
Nucleus |
|
| Expt B |
5
peptides |
22
spectra |
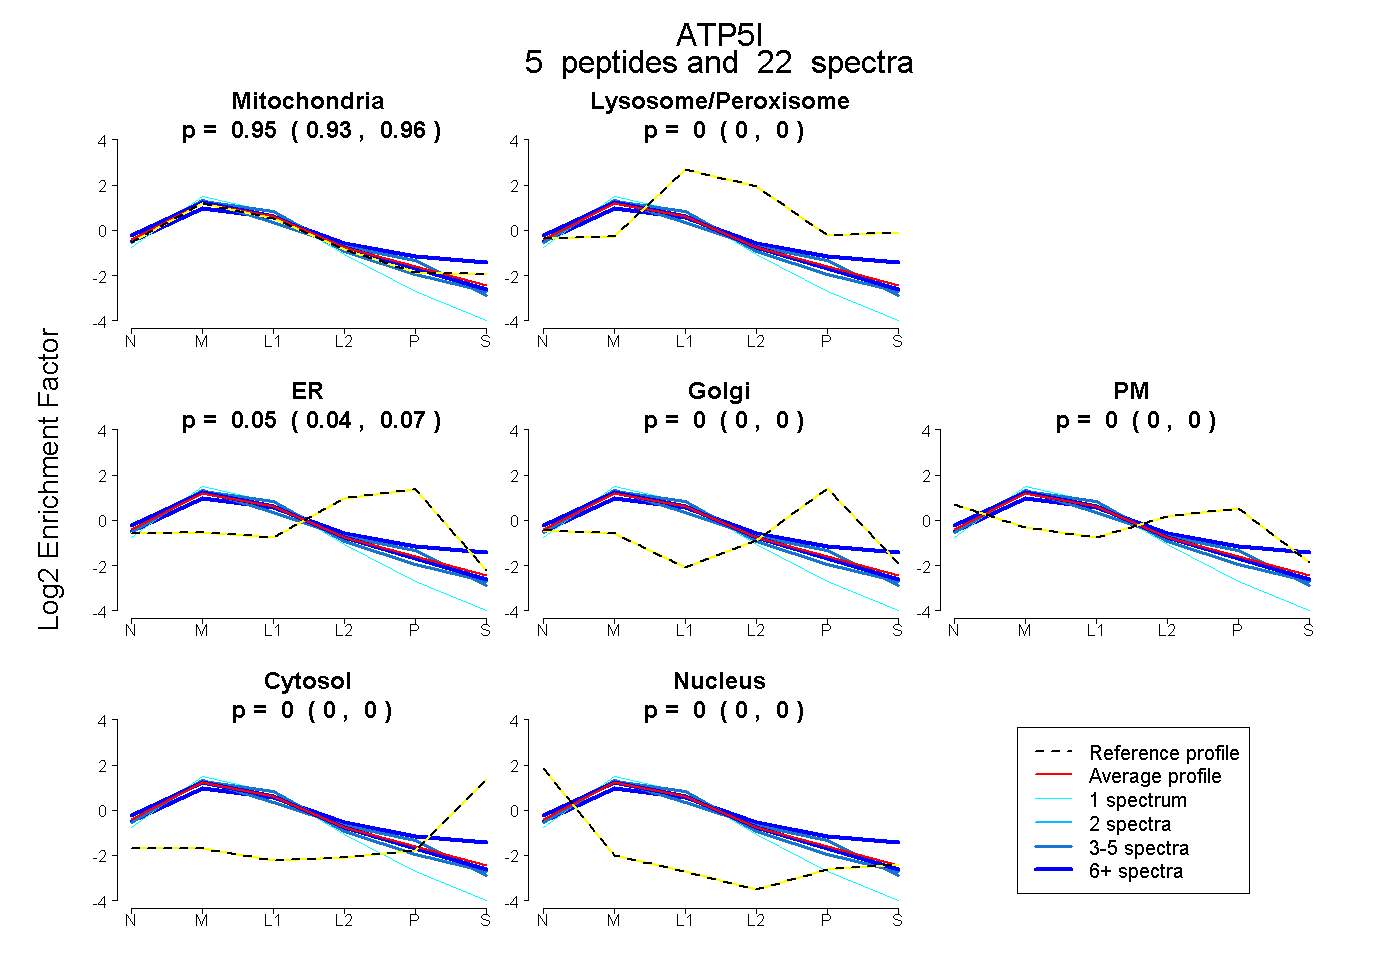 |
0.945
0.929 | 0.958 |
|
0.000
0.000 | 0.000 |
|
0.055
0.038 | 0.068 |
0.000
0.000 | 0.000 |
0.000
0.000 | 0.001 |
0.000
0.000 | 0.000 |
0.000
0.000 | 0.000 |
|
| 7 spectra, ELAEAEDVSIFK |
0.733 |
|
0.148 |
|
0.000 |
0.095 |
0.000 |
0.024 |
0.000 |
|
| 3 spectra, VPPVQVSPLIK |
0.996 |
|
0.000 |
|
0.000 |
0.000 |
0.000 |
0.000 |
0.004 |
|
| 3 spectra, YSALILGMAYGAK |
0.877 |
|
0.000 |
|
0.123 |
0.000 |
0.000 |
0.000 |
0.000 |
|
| 1 spectrum, LAAEEK |
1.000 |
|
0.000 |
|
0.000 |
0.000 |
0.000 |
0.000 |
0.000 |
|
| 8 spectra, YSYLKPR |
0.951 |
|
0.000 |
|
0.000 |
0.000 |
0.049 |
0.000 |
0.000 |
|
| | | Plot |
|
Lyso |
|
|
|
|
|
|
|
Other |
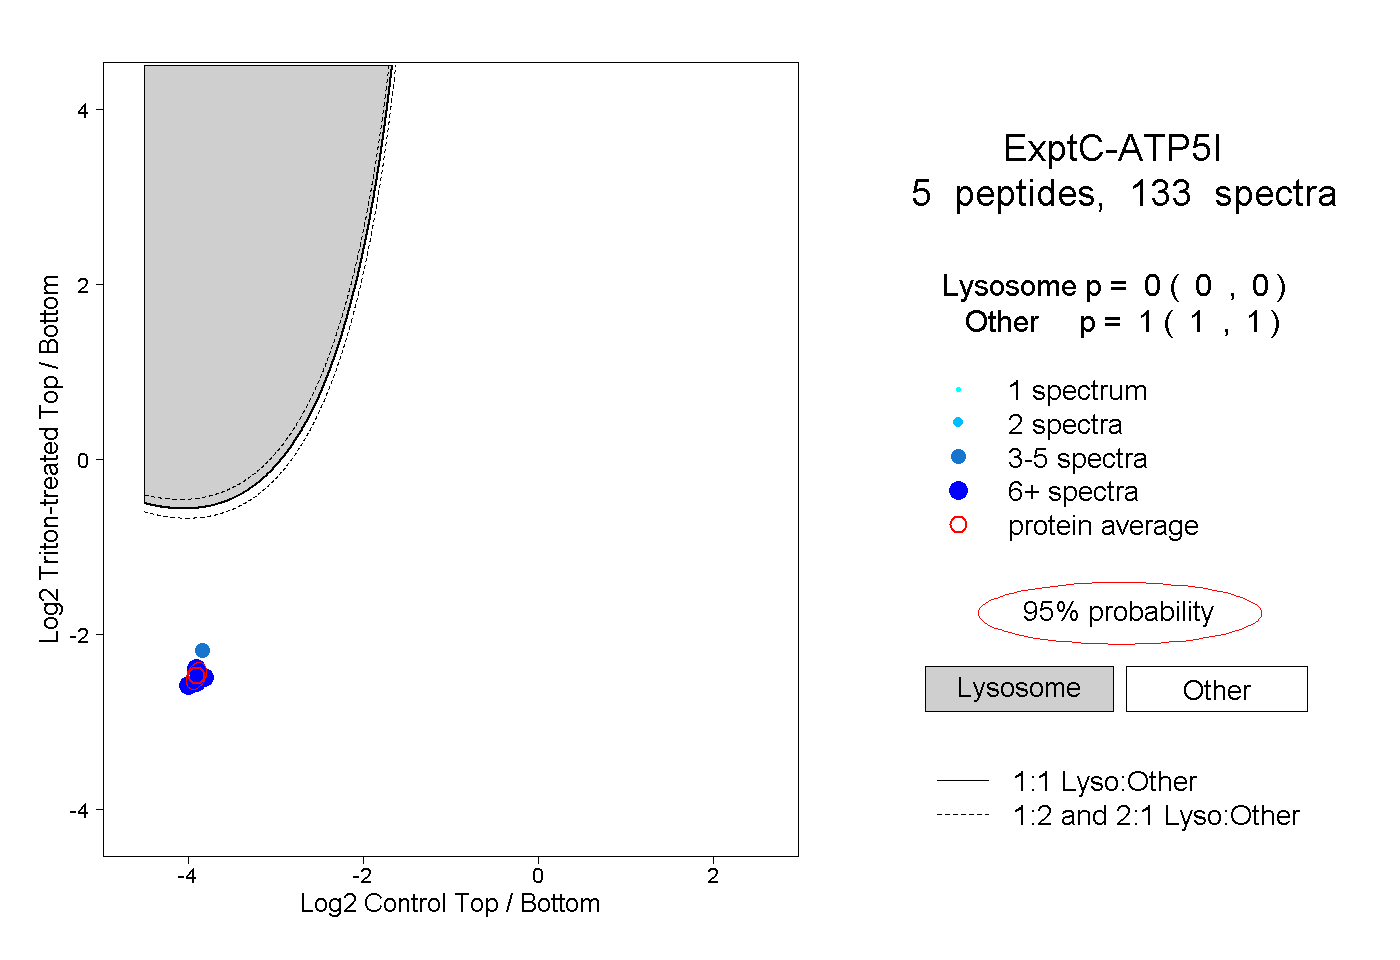
| Expt C |
5
peptides |
133
spectra |
 |
|
0.000
0.000 | 0.000 |
|
|
|
|
|
|
|
1.000
1.000 | 1.000 |
| | | Plot |
|
Lyso |
|
|
|
|
|
|
|
Other |
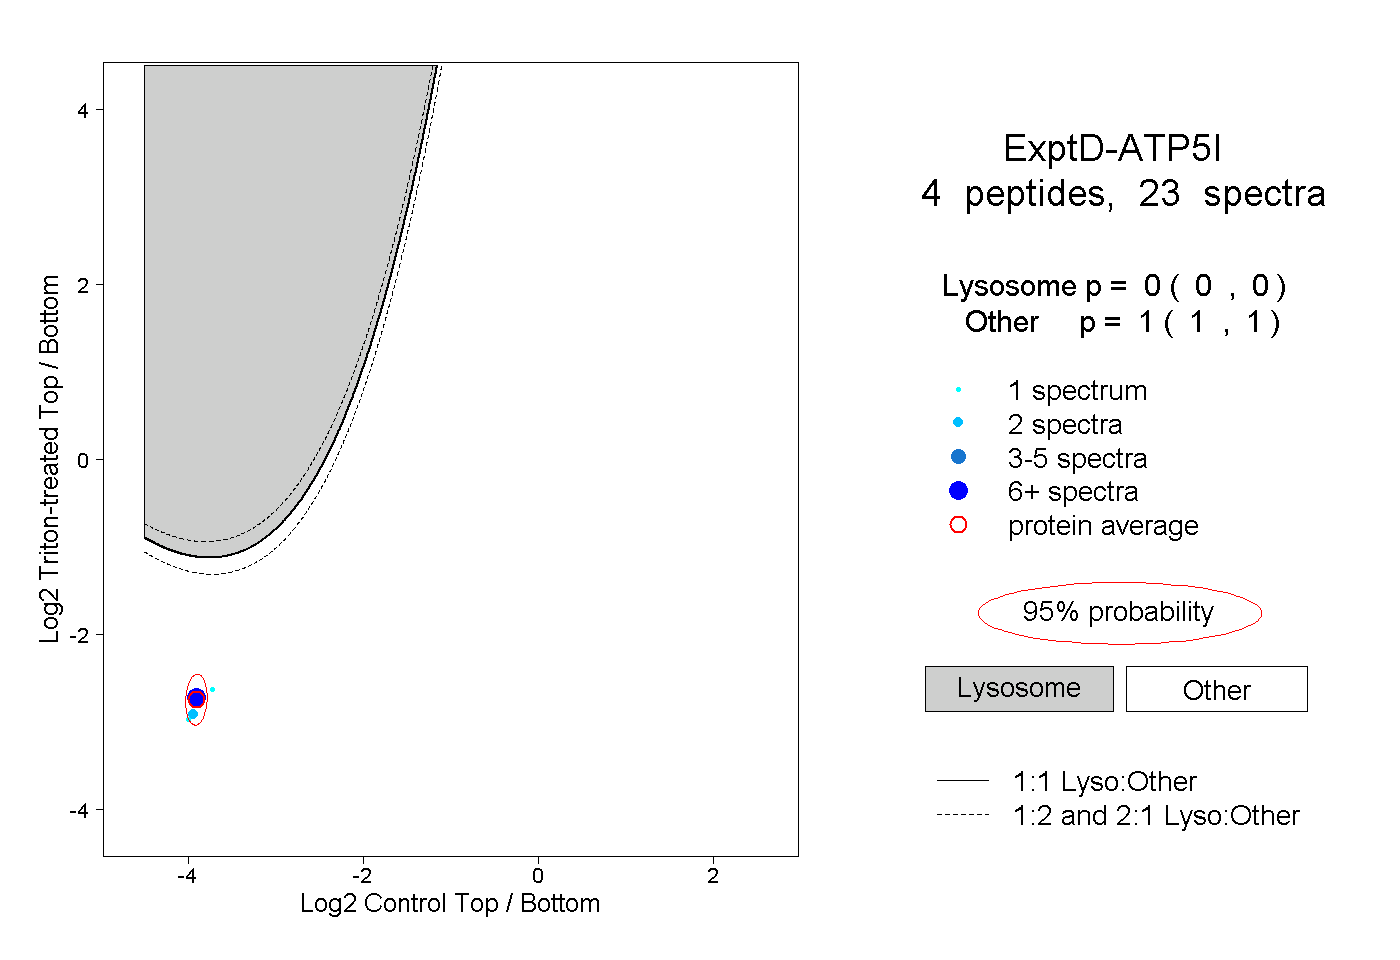
| Expt D |
4
peptides |
23
spectra |
 |
|
0.000
0.000 | 0.000 |
|
|
|
|
|
|
|
1.000
1.000 | 1.000 |