 4
4peptides
spectra
0.687 | 0.717
0.000 | 0.000
0.003 | 0.035
0.072 | 0.163
0.000 | 0.000
0.095 | 0.208
0.000 | 0.000
0.000 | 0.000
| Plot | Mito | Lyso | Perox | ER | Golgi | PM | Cytosol | Nucleus | |||||
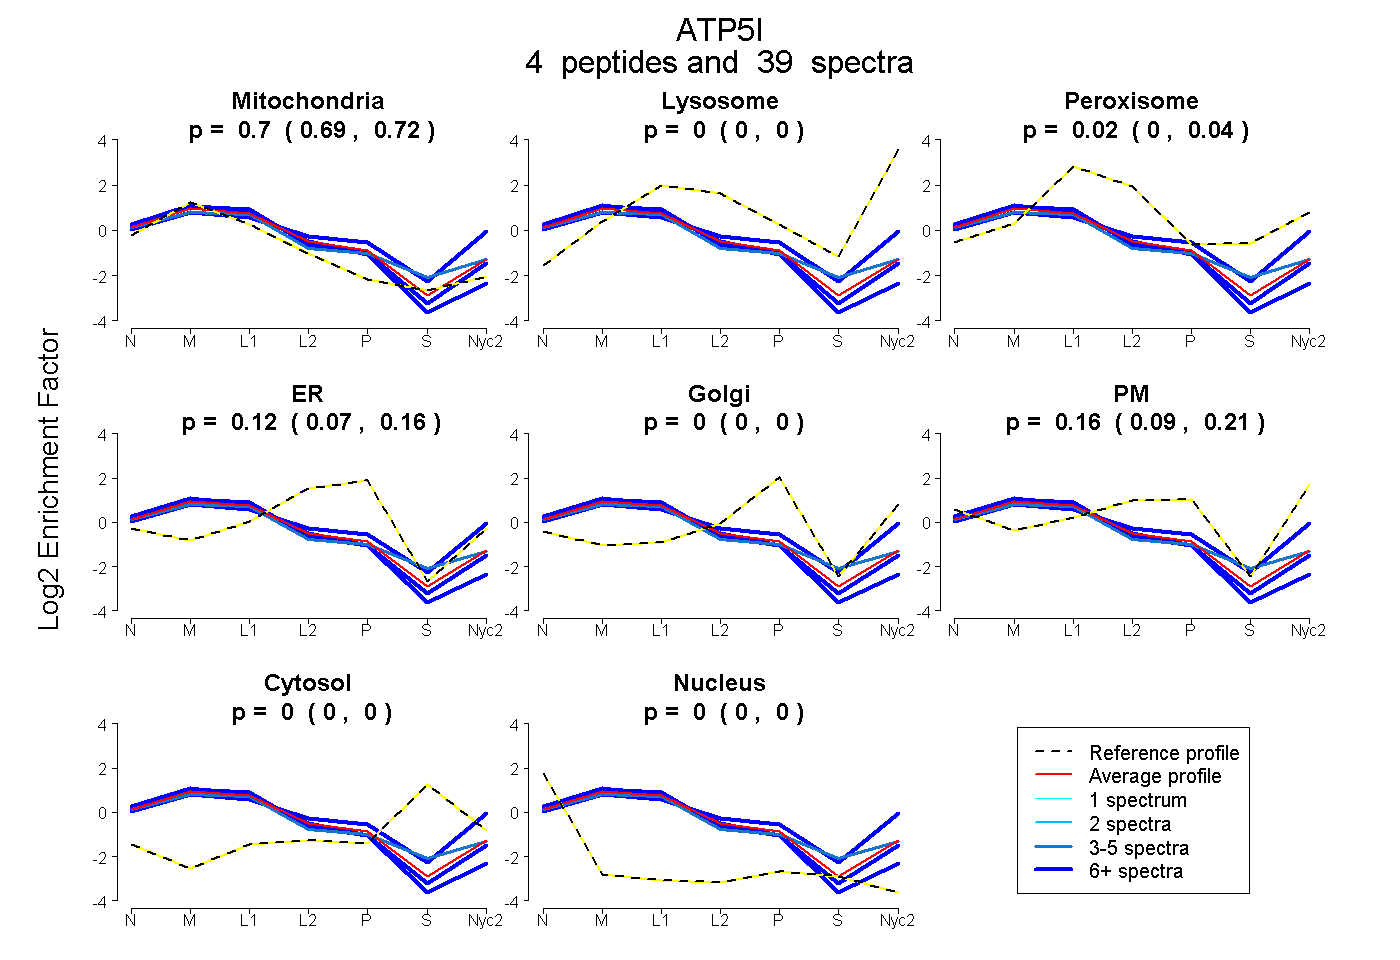
| Expt A |
4 peptides |
39 spectra |
|
0.703 0.687 | 0.717 |
0.000 0.000 | 0.000 |
0.020 0.003 | 0.035 |
0.121 0.072 | 0.163 |
0.000 0.000 | 0.000 |
0.155 0.095 | 0.208 |
0.000 0.000 | 0.000 |
0.000 0.000 | 0.000 |
| 13 spectra, ELAEAEDVSIFK | 0.814 | 0.000 | 0.000 | 0.186 | 0.000 | 0.000 | 0.000 | 0.000 | ||
| 10 spectra, VPPVQVSPLIK | 0.764 | 0.000 | 0.000 | 0.119 | 0.000 | 0.117 | 0.000 | 0.000 | ||
| 13 spectra, YSALILGMAYGAK | 0.528 | 0.120 | 0.004 | 0.000 | 0.006 | 0.342 | 0.000 | 0.000 | ||
| 3 spectra, YSYLKPR | 0.663 | 0.000 | 0.168 | 0.000 | 0.140 | 0.003 | 0.000 | 0.026 |
| Plot | Mito | Lyso or Perox | ER | Golgi | PM | Cytosol | Nucleus | ||||||
| Expt B |
5 peptides |
22 spectra |
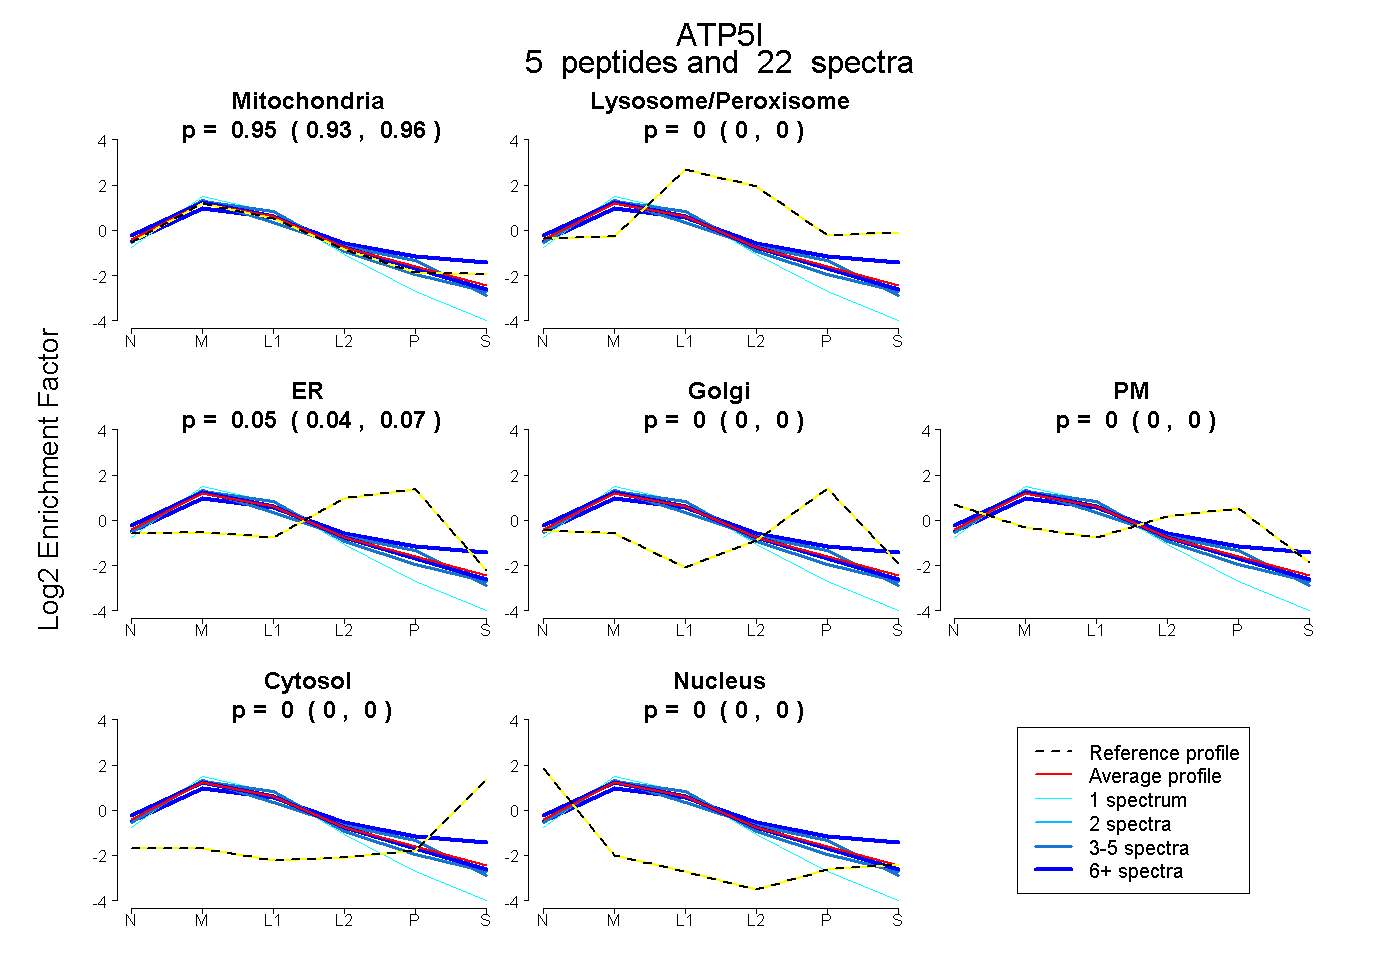 |
0.945 0.929 | 0.958 |
0.000 0.000 | 0.000 |
0.055 0.038 | 0.068 |
0.000 0.000 | 0.000 |
0.000 0.000 | 0.001 |
0.000 0.000 | 0.000 |
0.000 0.000 | 0.000 |
|||
| Plot | Lyso | Other | |||||||||||
| Expt C |
5 peptides |
133 spectra |
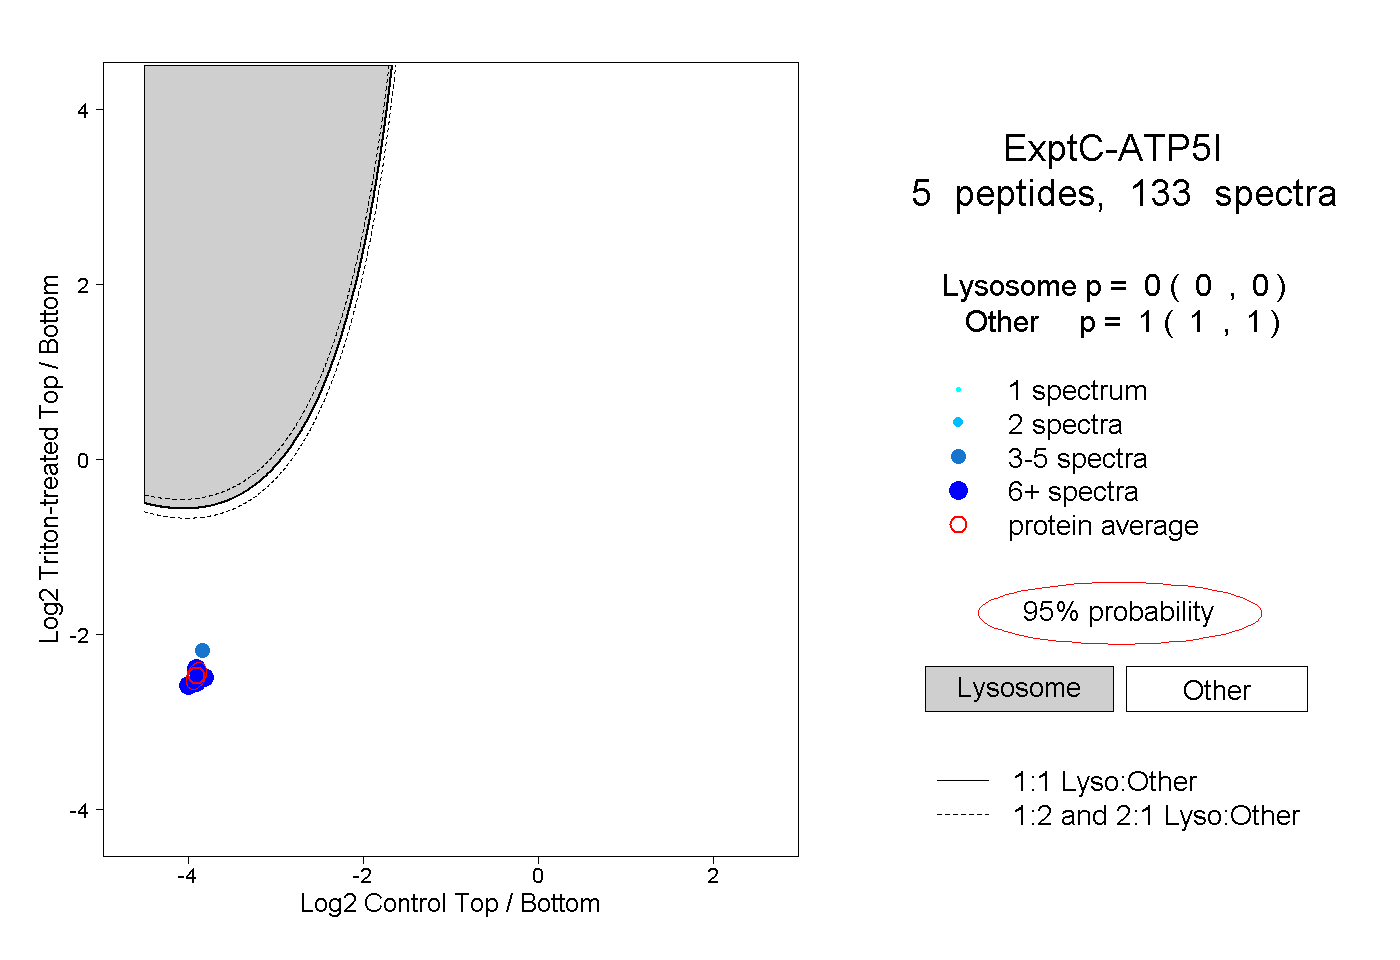 |
0.000 0.000 | 0.000 |
1.000 1.000 | 1.000 |
||||||||
| Plot | Lyso | Other | |||||||||||
| Expt D |
4 peptides |
23 spectra |
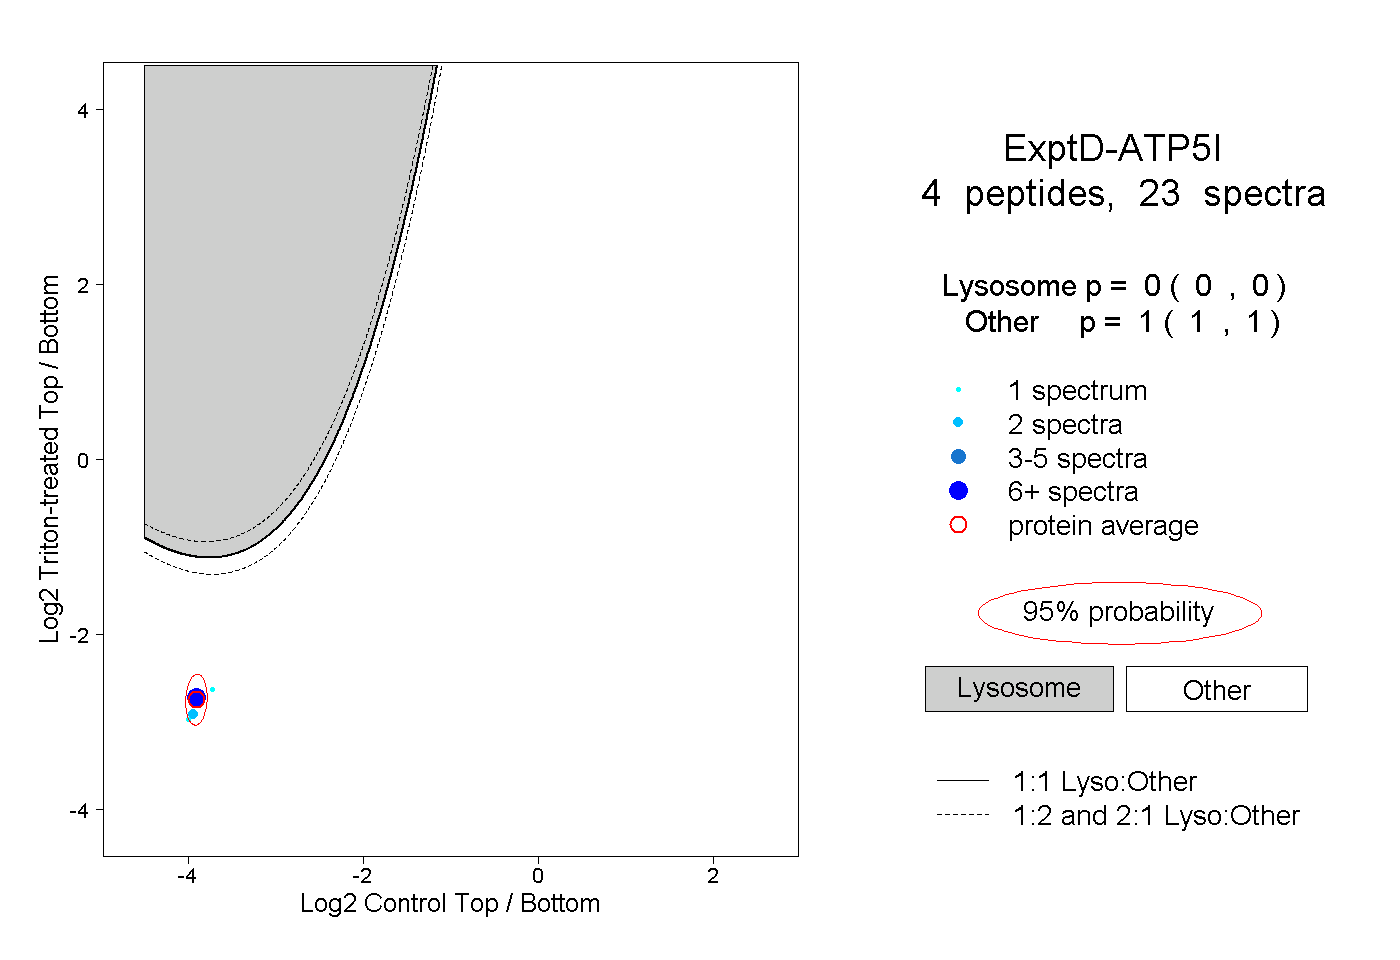 |
0.000 0.000 | 0.000 |
1.000 1.000 | 1.000 |