4
4peptides
spectra
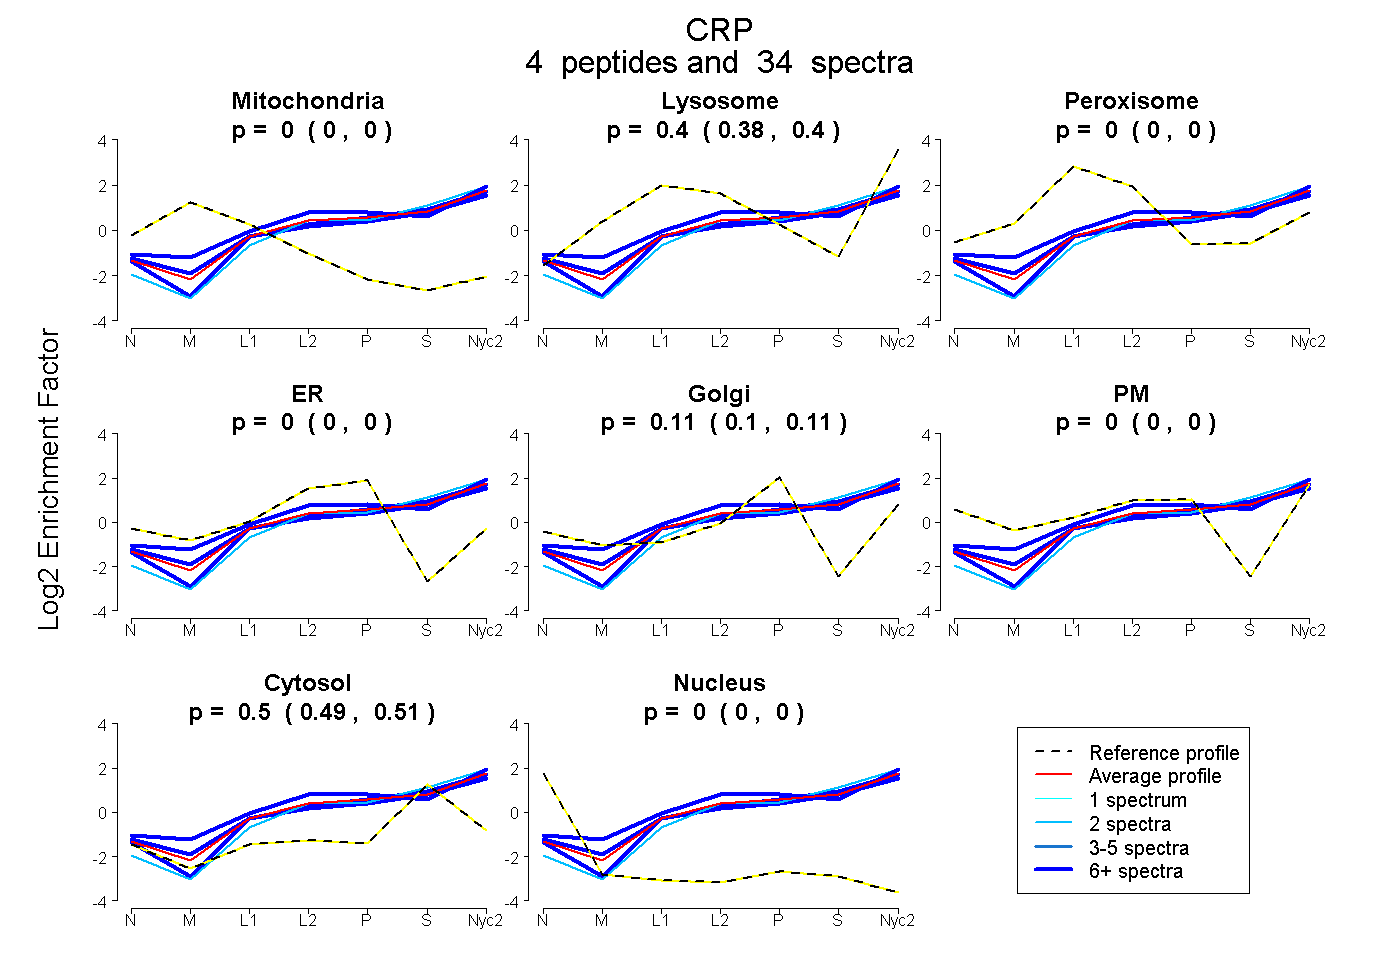
0.000 | 0.000
0.384 | 0.404
0.000 | 0.000
0.000 | 0.000
0.097 | 0.113
0.000 | 0.000
0.490 | 0.507
0.000 | 0.000
4peptides
spectra
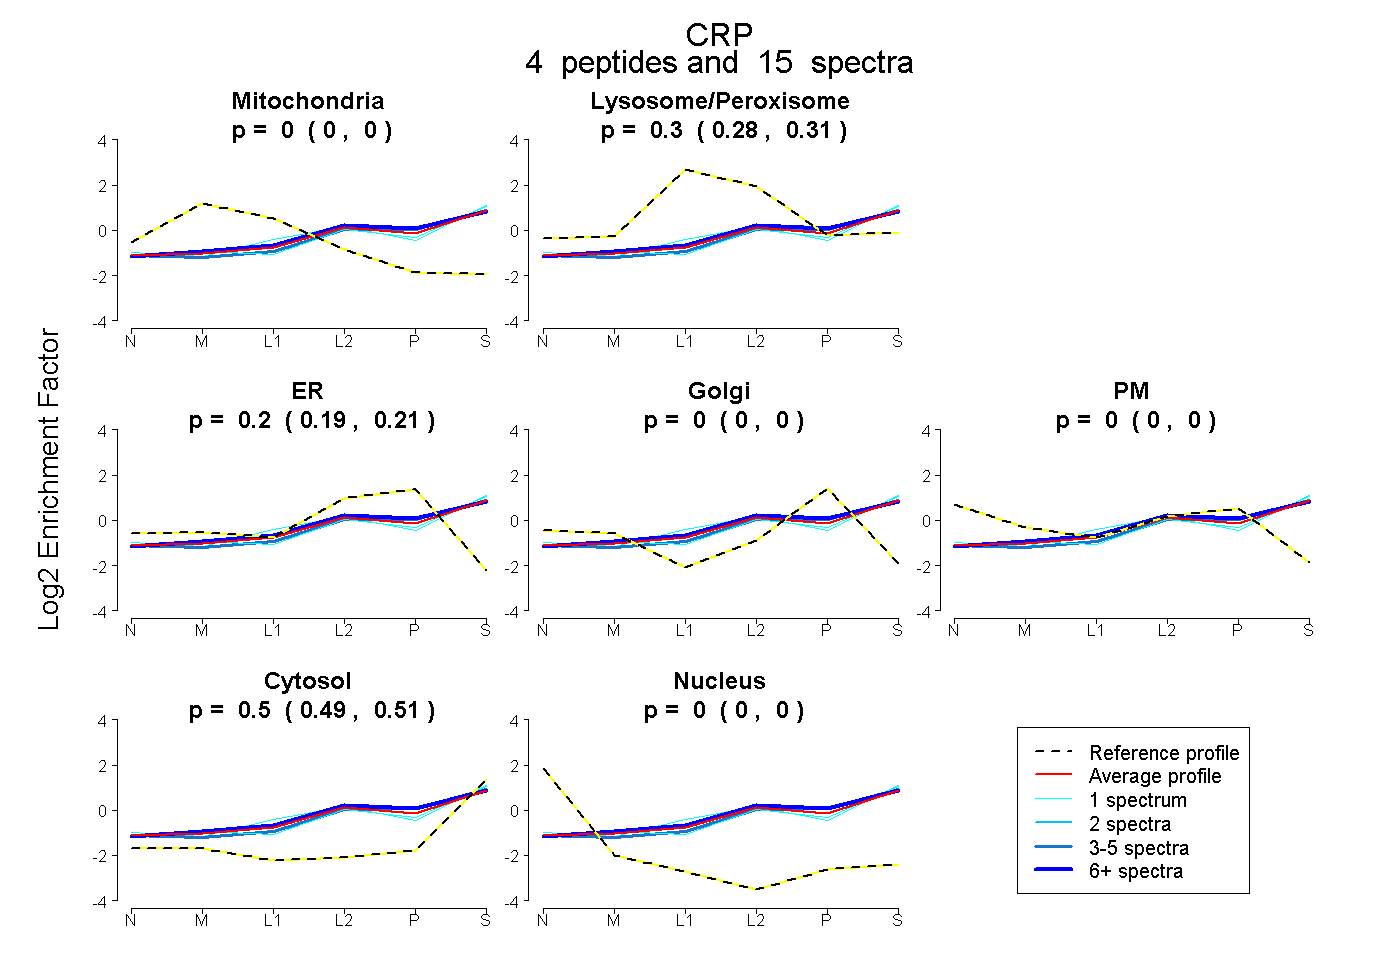
0.000 | 0.000
0.283 | 0.308
0.189 | 0.214
0.000 | 0.000
0.000 | 0.000
0.493 | 0.508
0.000 | 0.000