 3
3peptides
spectra
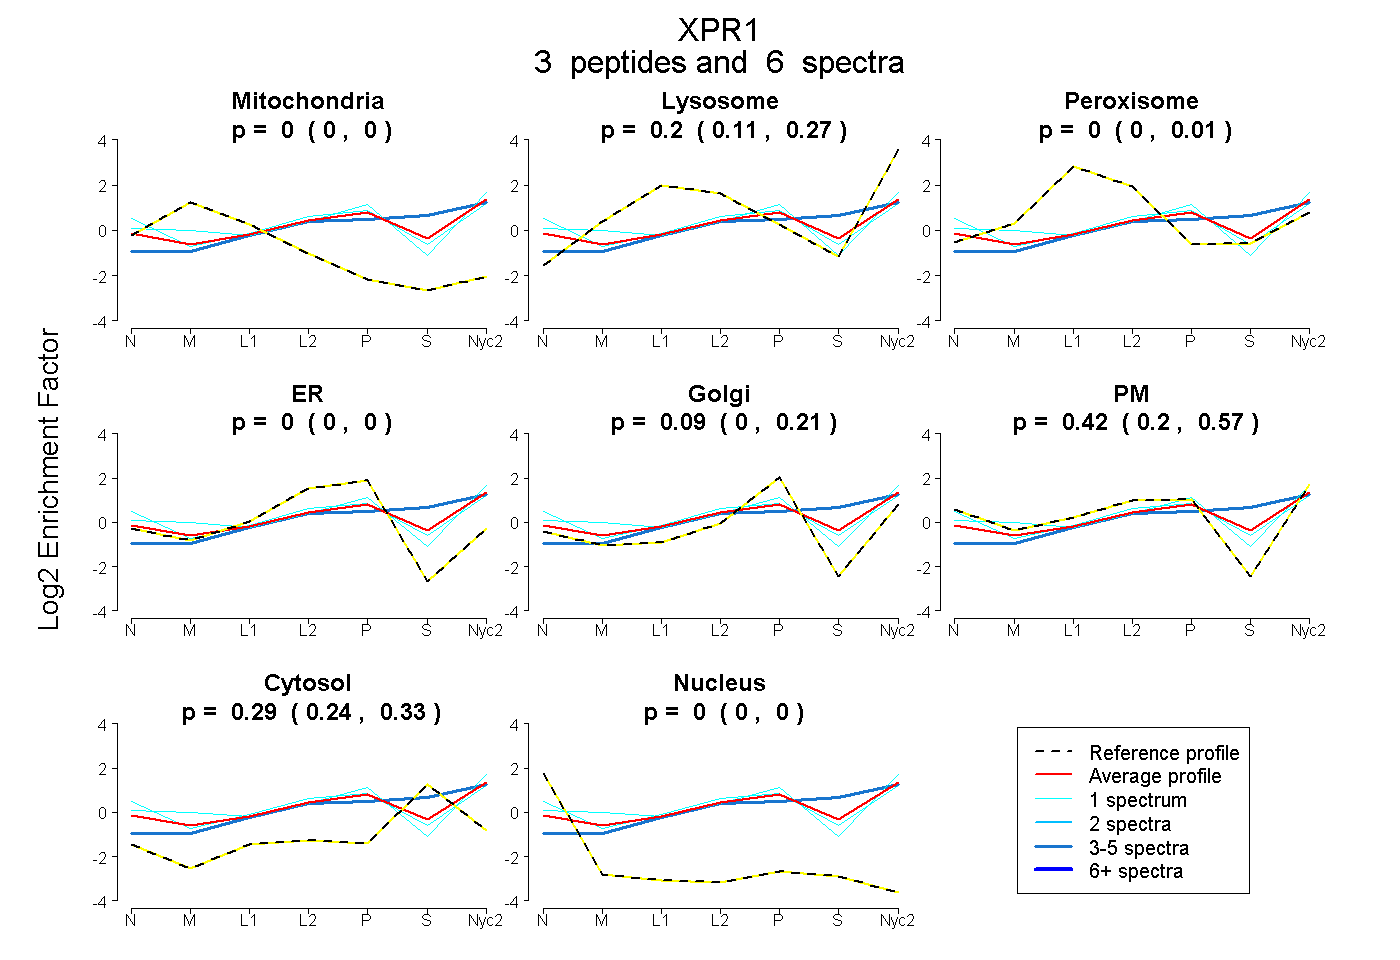
0.000 | 0.000
0.114 | 0.272
0.000 | 0.010
0.000 | 0.000
0.000 | 0.209
0.202 | 0.574
0.245 | 0.331
0.000 | 0.000
1peptide
spectra
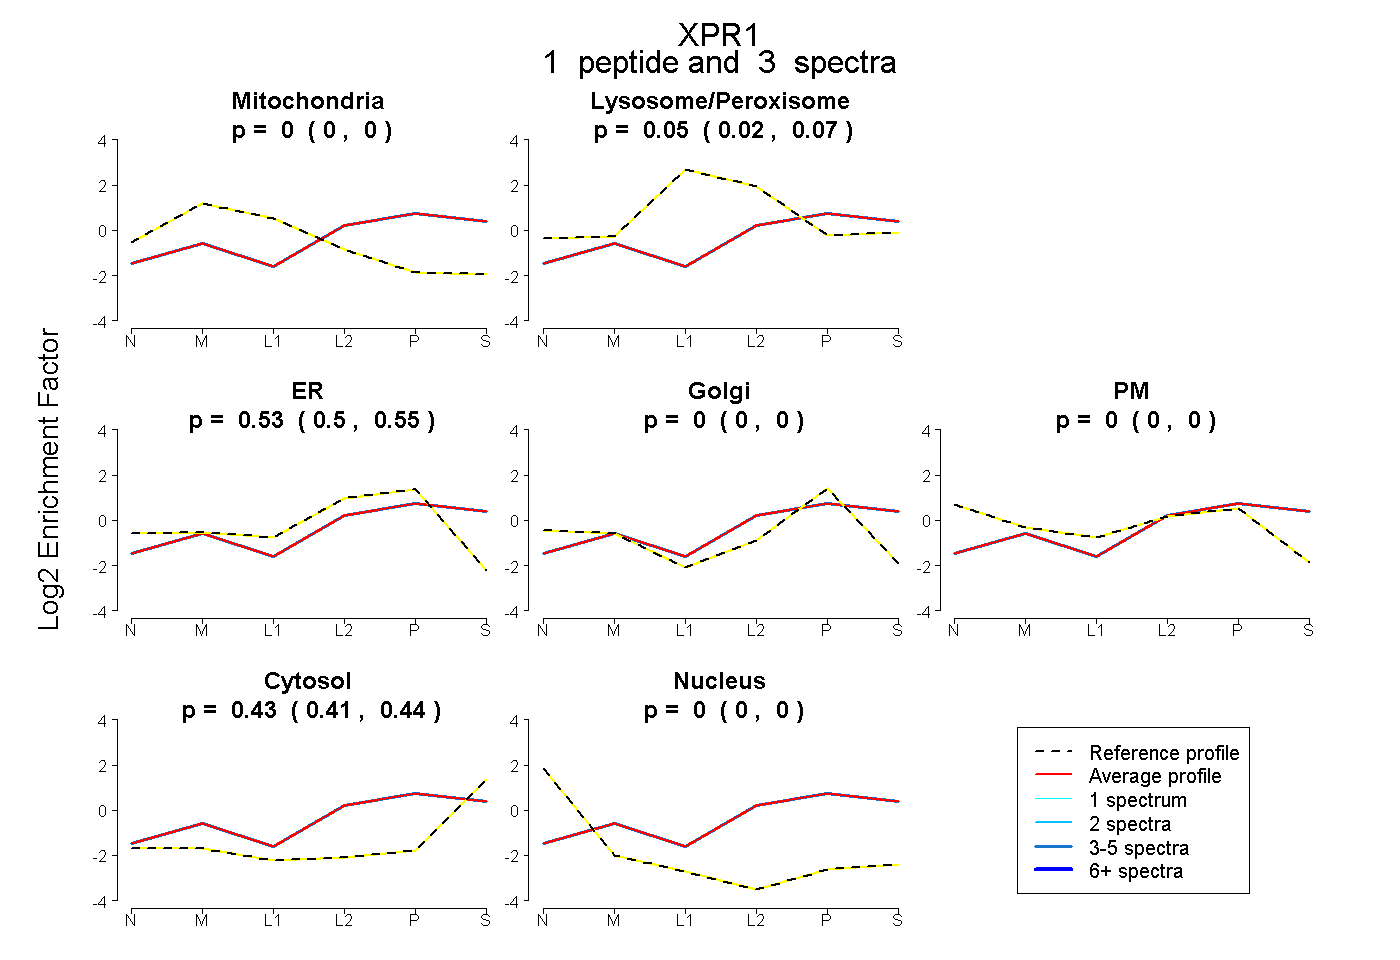
0.000 | 0.000
0.018 | 0.066
0.498 | 0.550
0.000 | 0.000
0.000 | 0.000
0.406 | 0.444
0.000 | 0.000
4peptides
spectra
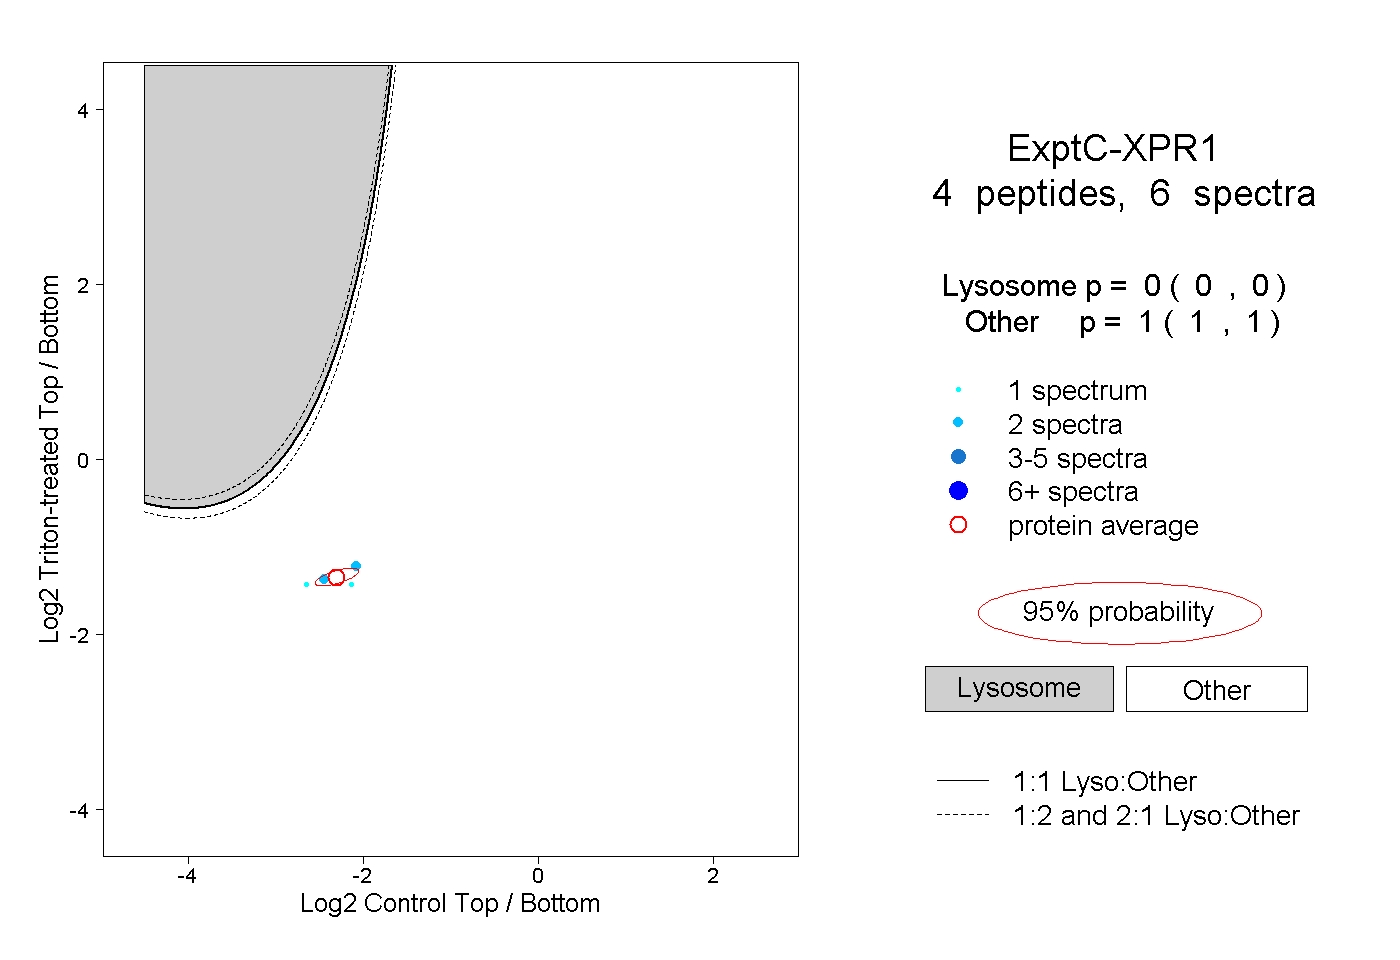
0.000 | 0.000
1.000 | 1.000