 1
1peptide
spectra
NA | NA
NA | NA
NA | NA
NA | NA
NA | NA
NA | NA
NA | NA
NA | NA
1peptide
spectra
0.002 | 0.177
0.000 | 0.242
0.000 | 0.000
0.000 | 0.013
0.312 | 0.594
0.235 | 0.369
0.000 | 0.000
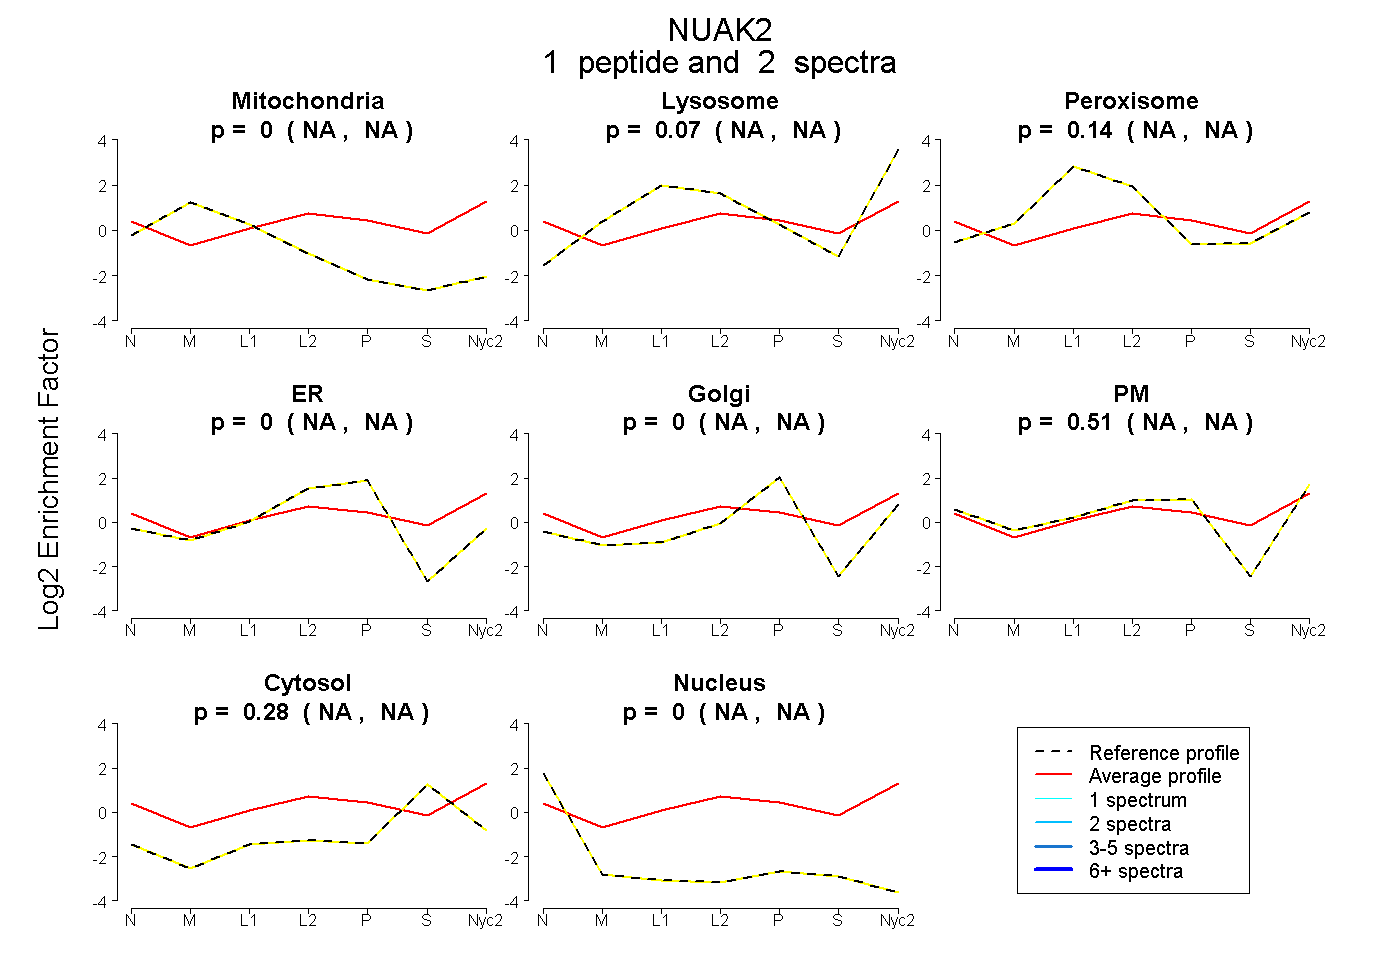
| Plot | Mito | Lyso | Perox | ER | Golgi | PM | Cytosol | Nucleus | |||||
| Expt A |
1 peptide |
2 spectra |
|
0.000 NA | NA |
0.072 NA | NA |
0.140 NA | NA |
0.000 NA | NA |
0.000 NA | NA |
0.513 NA | NA |
0.275 NA | NA |
0.000 NA | NA |
||
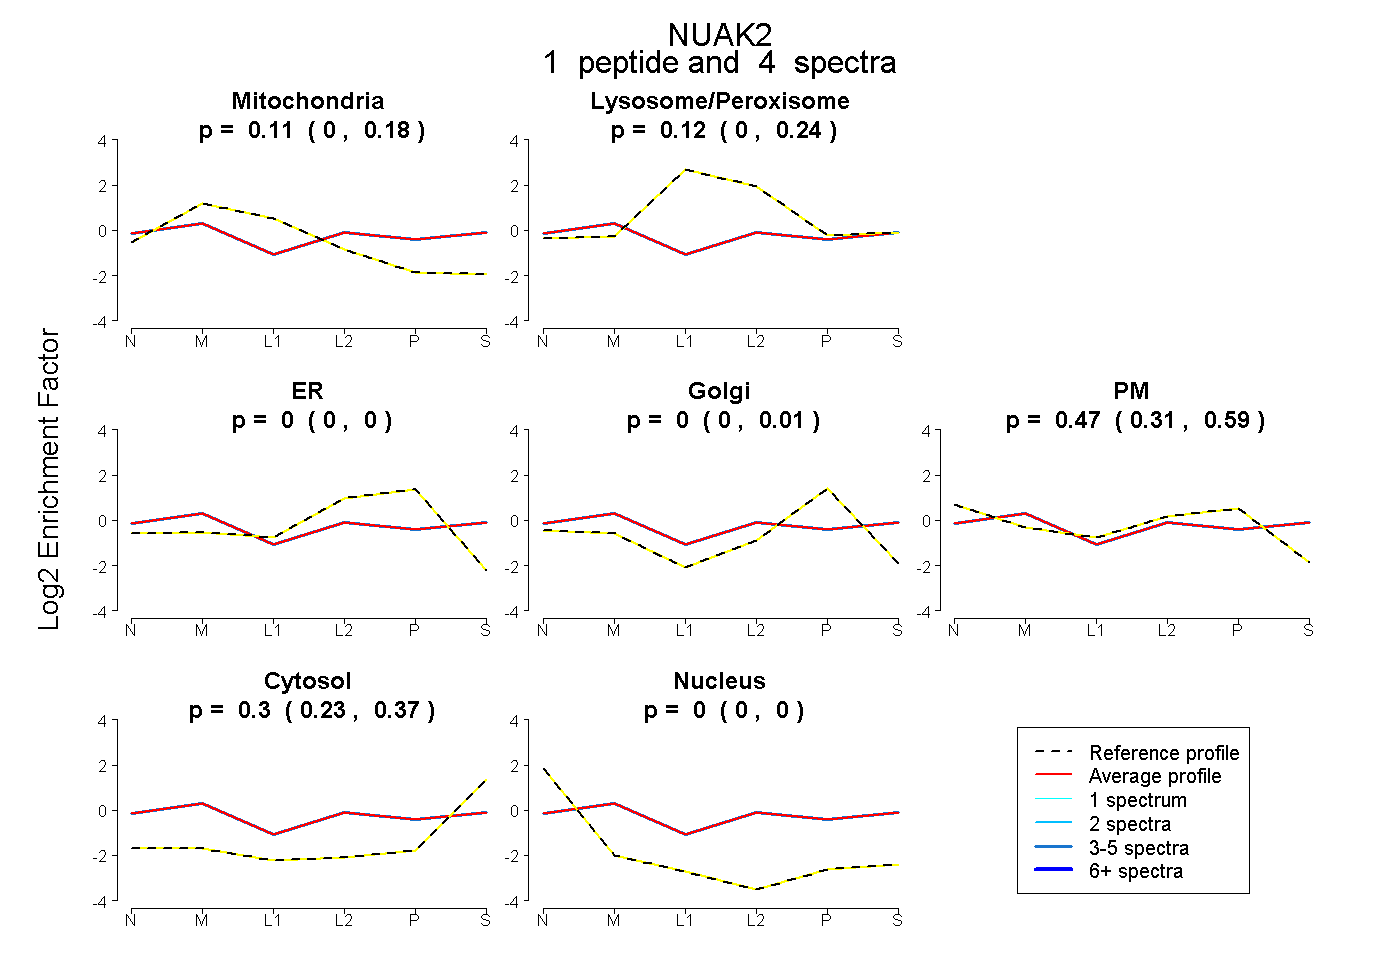
| Plot | Mito | Lyso or Perox | ER | Golgi | PM | Cytosol | Nucleus | ||||||
| Expt B |
1 peptide |
4 spectra |
|
0.107 0.002 | 0.177 |
0.119 0.000 | 0.242 |
0.000 0.000 | 0.000 |
0.000 0.000 | 0.013 |
0.470 0.312 | 0.594 |
0.304 0.235 | 0.369 |
0.000 0.000 | 0.000 |